YouTube Statistics 2026: Users, Revenue and Shorts Trends

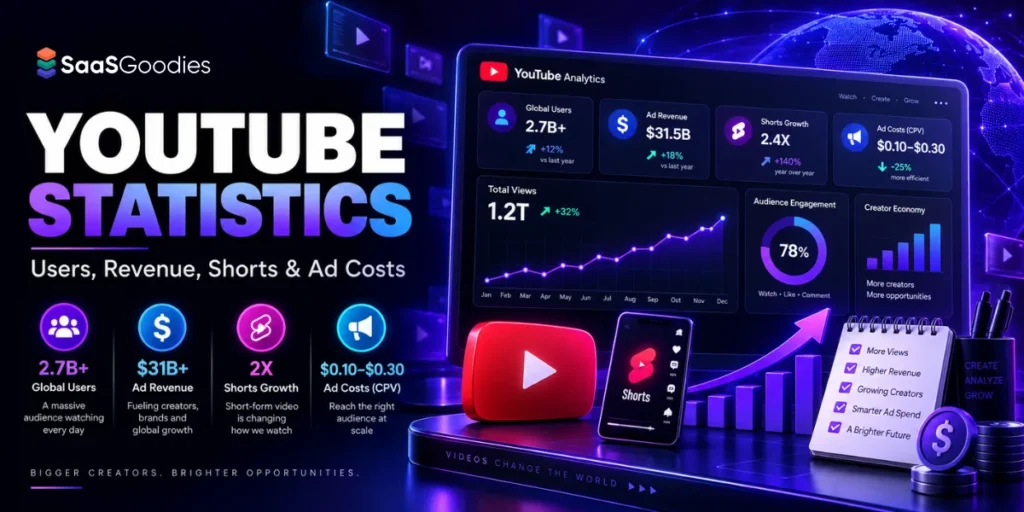
The quick answer: YouTube sits between 2.70 and 2.85 billion monthly users in 2026. Revenue passed $60 billion last year, and Shorts now serves 200 billion views a day. Ad income alone hit $40.37 billion, and worldwide ad revenue looks set to clear $45 billion this year.
Connected TV has overtaken mobile as the biggest watch surface in the United States. We have been buying and measuring video channels since 2015. Below you get the numbers, the source conflicts, and our own read for SaaS teams.
YouTube Monthly Active Users in 2026: Two Numbers, Both Correct
Global reach is the stat everyone quotes and almost everyone gets muddled.
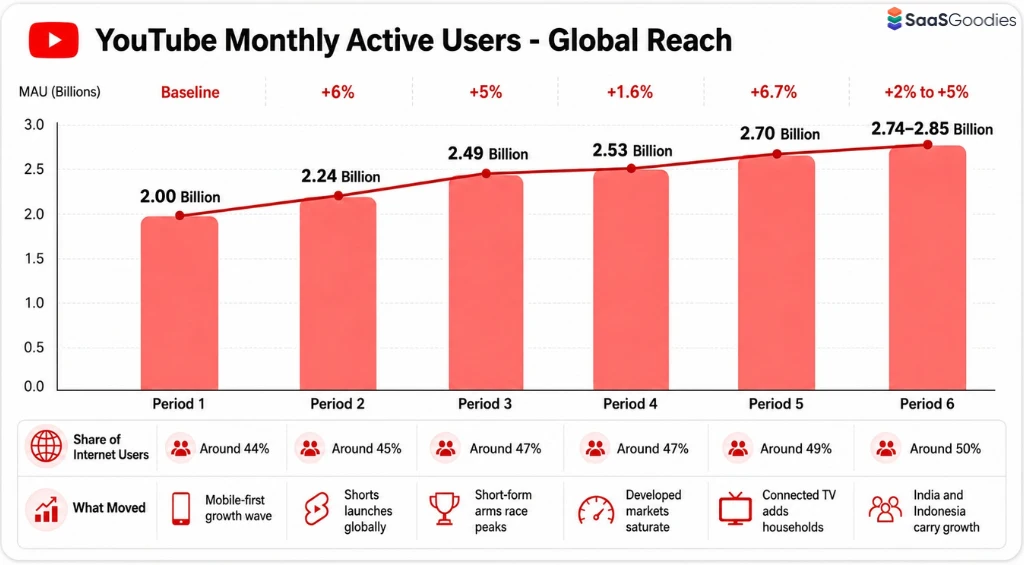
YouTube monthly active users land somewhere between 2.70 and 2.85 billion in 2026. DataReportal's global report puts the base near 2.74 billion. Alphabet does not publish a clean monthly figure, so analysts model it.
Then there is potential ad reach, which counts targetable accounts rather than humans. That sits closer to 2.58 billion. Ad reach grew only around 1.6% across twelve months, adding roughly 39.7 million reachable accounts.
So the honest read: reach is huge, and growth has cooled to single digits.
| Year | Monthly Active Users | Yearly Change | Share of Internet Users | What Moved |
|---|---|---|---|---|
| 2019 | 2.00 billion | Baseline | Around 44% | Mobile-first growth wave |
| 2021 | 2.24 billion | +6% a year | Around 45% | Shorts launches globally |
| 2023 | 2.49 billion | +5% a year | Around 47% | Short-form arms race peaks |
| 2024 | 2.53 billion | +1.6% | Around 47% | Developed markets saturate |
| 2025 | 2.70 billion | +6.7% | Around 49% | Connected TV adds households |
| 2026 | 2.74 to 2.85 billion | +2% to +5% | Around 50% | India and Indonesia carry growth |
Daily numbers are messier still. Around 122 million people are widely reported as daily visitors, a figure YouTube itself cited years ago and never refreshed. Newer modelling puts daily actives closer to 1.06 billion.
SaaSGoodies data insight: Ignore the 122 million daily figure. It is stale and it makes YouTube look smaller than every other major platform, which is nonsense given a billion-plus hours watched daily. Use 2.74 billion monthly for planning decks and note the source. Anyone quoting 122 million daily actives in 2026 has not checked their own citation.
Where YouTube Viewers Actually Live: Country Data for 2026
Reach and revenue live in different countries. Missing that gap wrecks a lot of media plans.
India is the largest audience by a wide margin. Statista's most recent country estimates put India's advertising reach near 518 million, while DataReportal's count sits around 491 million. Either way, no other market comes close.
The United States is roughly half India's size on users, yet delivers close to 30% of global ad income. That is the whole story of YouTube advertising audience reach in one line.
| Country | YouTube Users | Share of Global Base | Typical CPM Range | Why SaaS Teams Should Care |
|---|---|---|---|---|
| India | 491 to 518 million | Around 18% | $0.50 to $1.50 | Cheap reach, low ARPU, strong for top-of-funnel awareness |
| United States | 253 to 259 million | Around 9% | $5.00 to $15.00 | Roughly 30% of ad revenue, highest buying power |
| Brazil | 144 to 147 million | Around 5% | $1.00 to $3.00 | Fast-growing SaaS market, low competition |
| Indonesia | 139 to 151 million | Around 5% | $0.60 to $2.00 | Mobile-only viewing, vertical creative wins |
| Mexico | Around 83.6 million | Around 3% | $1.50 to $4.00 | Strong Spanish-language demand |
| United Kingdom | Around 55.5 million | Around 2% | $6.00 to $16.00 | Second most-watched media service nationally |
Two more figures worth holding on to. Pew reports that 83% to 84% of American adults use YouTube, ahead of every other platform tracked. Among American teenagers, usage hits 90%.
China remains blocked, which quietly removes more than a billion potential viewers from every global total you will ever read.
Watch Time, Uploads and Daily Habits Behind the Reach
Scale means nothing without attention. YouTube has both, and the gap over rivals is not close.
Upload volume is the number that should temper any “we will just post more” strategy. Twenty million uploads a day means roughly 600 million new videos every month competing for the same feed slots.
Channel counts tell a friendlier story. Around 115 million channels exist, with roughly 69 million counted as active creators. Only about 4.4% of users run a channel at all.
Our read on supply: Supply looks terrifying until you segment it. Almost all of that 20 million daily upload volume is entertainment, music and reaction content. In B2B software categories, the supply of well-made explainer and comparison video is still thin.
We regularly find SaaS keywords with strong monthly search demand and fewer than five decent videos ranking. That gap is closing, but it has not closed yet.
YouTube Revenue 2026: Inside the $60 Billion Business
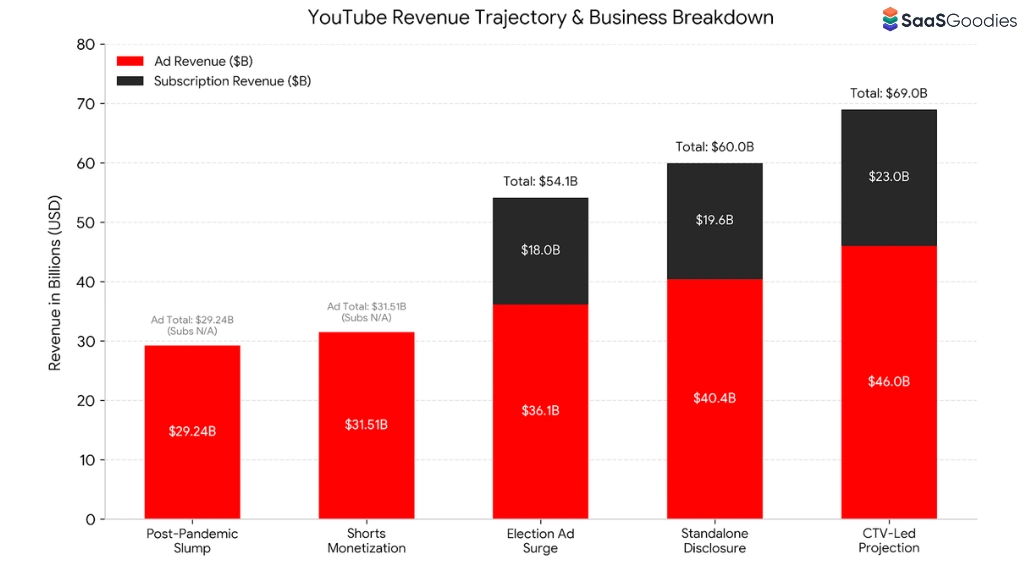
Alphabet broke out YouTube's full-year revenue for the first time last year, and the figure reset how the industry values the platform.
Total revenue passed $60 billion in 2025. Advertising delivered $40.37 billion of that, an 11.7% rise on the prior year. Subscriptions across Premium, Music, YouTube TV and NFL Sunday Ticket contributed roughly $19.6 billion.
Context helps. Netflix reported $45.18 billion for the same year. Disney reported $95.7 billion. YouTube now sits between them as a media business.
| Year | Ad Revenue | Subscription Revenue | Total Revenue | Ad Growth | Notes |
|---|---|---|---|---|---|
| 2022 | $29.24 billion | Not disclosed | Not disclosed | +1.3% | Post-pandemic ad slump |
| 2023 | $31.51 billion | Not disclosed | Not disclosed | +7.8% | Shorts monetisation begins |
| 2024 | $36.15 billion | Around $18.0 billion | Around $54.2 billion | +14.7% | US election ad surge |
| 2025 | $40.37 billion | Around $19.6 billion | Over $60.0 billion | +11.7% | First standalone disclosure |
| 2026 forecast | $45 to $47 billion | $22 to $24 billion | $67 to $70 billion | +11% to +16% | Our projection, CTV led |
Subscriptions deserve more attention than they get. Alphabet reported over 325 million paid subscriptions across its consumer services, with Premium and Google One driving adoption. YouTube Premium and Music together passed 125 million paid subscribers.
YouTube TV holds around 10 million subscribers and its core revenue is expected to approach $10 billion this year. Analyst modelling from MoffettNathanson values YouTube as a standalone business at $500 billion to $560 billion.
Below is how the ad line has compounded. The 2026 bar is our own forecast, not a reported figure.
YouTube Ad Costs SaaS Teams Should Budget For
This is where most of our client conversations start. What does a view actually cost, and what should a software company expect to pay?
Cross-network cost per view averages around $0.024 for skippable in-stream campaigns. Restrict delivery to YouTube inventory only and that climbs to roughly $0.029 to $0.039.
Vertical matters far more than the average. Consumer goods sit near $0.018 per view. Legal reaches $0.058. B2B software sits well above the mid-point, and cost inflation there ran around 12% across the last year.
Format matters even more. Connected TV placements carry the highest cost and the lowest direct response.
| Ad Format | Typical CPM | Typical CPV | View or Completion Rate | Best Use for SaaS | Watch Out For |
|---|---|---|---|---|---|
| Skippable in-stream | $5 to $15 | $0.04 to $0.12 | 31% to 45% | Mid-funnel demand creation | Weak hooks burn budget in five seconds |
| In-feed video | $8 to $18 | $0.06 to $0.16 | CTR 1.0% to 3.0% | Capturing category research intent | Costs around 30% more per view than in-stream |
| Bumper (6 seconds) | $4 to $10 | Charged on impressions | Near full completion | Retargeting and reminder frequency | No room for a product explanation |
| Non-skippable in-stream | $10 to $22 | Charged on impressions | 85% to 95% | Launch announcements | Brand irritation at high frequency |
| Shorts feed ads | Around $4 | $0.01 to $0.05 | Low completion, high scroll | Cheap reach and creative testing | Rarely converts on its own |
| Connected TV | $18 to $32 | Around $0.038 | 90%-plus completion | Category awareness for high-ACV products | Almost no direct clicks, inflates CPA |
Cross-industry view rate sits around 31.9%. View-through conversion rates for software land between 0.4% and 1.8%. Assisted return on ad spend, measured across a 180-day window, tends to land between 1.8x and 3.8x.
One measurement gap keeps costing advertisers money. Around 78% of brand lift studies show an ad recall lift of six points or more, and 41% show measurable consideration lift. Fewer than one in four advertisers actually run them.
What we think: Judging YouTube on last-click conversions is the single most common mistake we see in SaaS accounts. Treat it as a six-touch nurture surface, not a search replacement. Our client data lines up with wider benchmarks.
Paired with retargeting on LinkedIn or Meta, assisted ROAS lands between 2x and 3x by day 180. Judged on day-seven last click, the same campaigns look broken. Same spend, two very different verdicts.
YouTube Shorts Statistics 2026: 200 Billion Daily Views
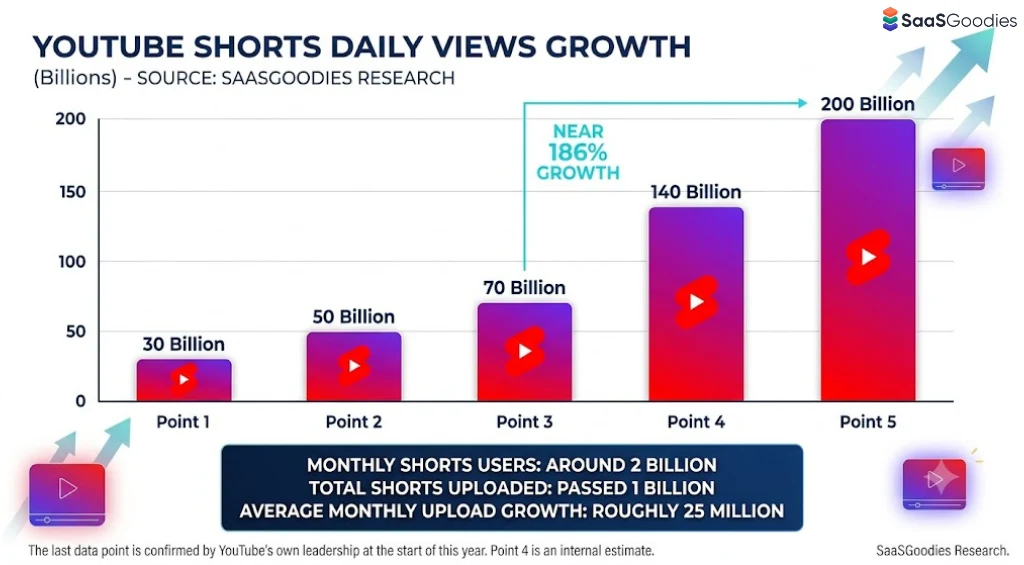
Short-form went from side project to the largest video format on earth.
YouTube Shorts daily views now average 200 billion, confirmed by YouTube's own leadership at the start of this year. Compare that with roughly 70 billion two years earlier and you get growth near 186%.
Monthly Shorts users sit around 2 billion. Total Shorts uploaded passed 1 billion, growing by roughly 25 million a month. Clip length now stretches to three minutes.
Now the payout reality, because reach and revenue diverge sharply here.
Shorts revenue works through a pooled model. Ad income from the feed goes into a regional pool, music licensing costs come off the top, and creators receive 45% of their view share. So you cannot multiply views by a fixed rate.
Numbers we would bet on: Shorts is a distribution engine, never a revenue engine. We model it that way for every client. One subscriber converted from Shorts into long-form viewing is worth roughly 100 to 200 times more than the Short that recruited them, purely on RPM difference.
Build Shorts to move people, not to monetise them. Anyone selling a Shorts-only income plan is selling maths that does not add up.
Connected TV Overtook Mobile: The Living Room Numbers
This is the structural shift that changed how we plan video buys, and plenty of SaaS teams have not caught up.
Connected TV passed mobile as the largest American watch surface. Roughly 60% of total United States watch time now happens on television screens. More than 200 million Americans watch on a connected TV each month.
Nielsen data shows YouTube share of US TV viewing near 12.7%, rising to around 13.2% in 2026 readings. Netflix trails at roughly 8.2%. YouTube has also passed Disney's whole portfolio on TV viewing time.
Streaming as a whole crossed 47% of American television viewing, a record. Broadcast and cable keep shedding share every year.
Behaviour on the big screen differs sharply from mobile. Average session length on connected TV runs past 45 minutes, against roughly 20 minutes on a phone. Co-viewing is common, so effective reach per impression rises.
Long-form is responding to that shift. American creators uploaded 6.6 million videos of twenty minutes or longer in early 2026, up more than half against three years earlier.
Our editorial call: If you sell software above roughly $15,000 in annual contract value, connected TV deserves a test budget this year. Not because it converts, but because buying committees average close to seven stakeholders, and most of them never touch your paid search terms.
We would cap it at 15% of video spend and measure on brand lift plus pipeline influence. Anything else and you will kill it in month two for the wrong reason.
Podcasts on YouTube: The Channel Most SaaS Brands Skip
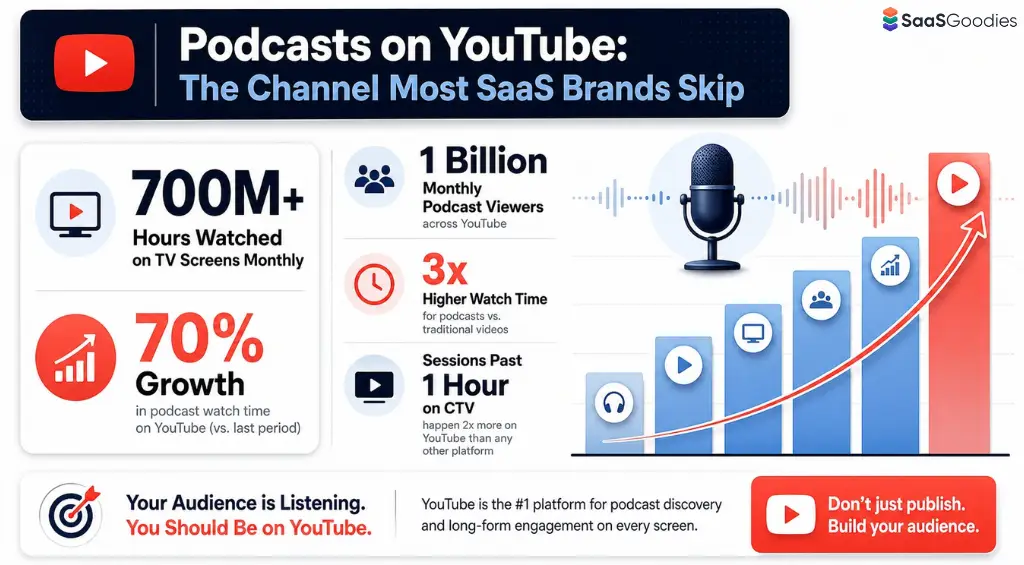
Podcasts have quietly become one of YouTube's strongest formats, and almost nobody in software is treating it seriously.
Viewers watched more than 700 million hours of podcasts on television screens in a single month last year, up around 70% year on year. Around 1 billion people watch podcast content on the platform monthly.
Television has become the fastest-growing device for podcast consumption. YouTube's own executives describe the format as the new late-night television slot.
From our own testing: We ran a founder-led interview series on one client channel and treated it as video first, audio second. Watch time per session came in over three times higher than their standard product explainer content. Sales cited it in deal notes within eight weeks.
Podcast video is currently the cheapest long-attention format available to a SaaS brand, and that window will not stay open once budgets catch up.
Creator Economy Numbers: Payouts, Partner Program and Thresholds
YouTube pays out more to creators than any other platform, and the structure changes next year.
Cumulative payouts to creators, artists and media partners passed $100 billion across the last four years. Annual creator ad payouts now run above $20 billion, driven by the 55/45 revenue split on long-form.
More than 3 million channels are enrolled in the Partner Program, up from 2 million four years ago. Only around 4.3% of all channels have qualified.
Current YouTube Partner Program thresholds offer two routes. Either 1,000 subscribers plus 4,000 valid long-form watch hours across twelve months, or 1,000 subscribers plus 10 million valid Shorts views across ninety days.
Those bars rise in 2027. Long-form moves to 8,000 watch hours. Shorts moves to 20 million views. The subscriber minimum stays put.
Earnings spread wildly by niche. Finance and business channels command $8 to $15 RPM and sometimes far more. Gaming sits nearer $1 to $4. Same platform, roughly a fifty-fold gap.
Key insight for marketers: The threshold increase in 2027 matters more for tool marketers than creators. Every affiliate and SaaS brand selling to new channel owners now has a deadline to sell against.
We expect a visible spike in demand for growth tools, thumbnail software and analytics platforms through late 2026. Creators will race to qualify under the old bar. If you promote creator tools, that is a campaign worth planning now.
YouTube Audience Demographics: Age, Gender and Device Split
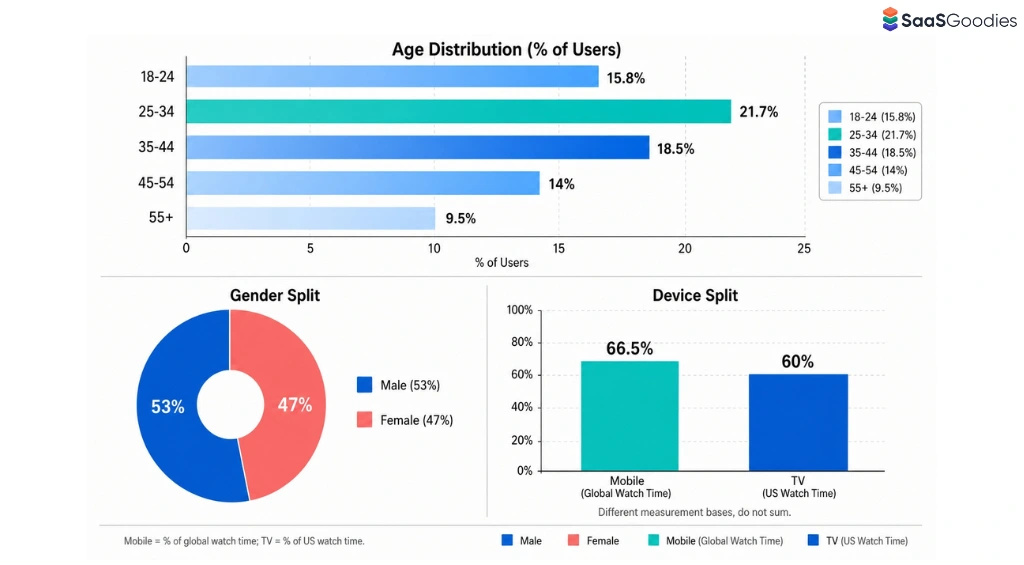
Targeting decisions need real distribution data, not the old stereotype that YouTube is a teenage platform.
The 25 to 34 bracket is the largest cohort at around 21.7% of users. The 35 to 44 group follows at 18.5%. Users aged 55 and over now account for 9% to 10%, and that slice keeps growing.
| Segment | Share of Users | Direction in 2026 | Buying Signal for SaaS | Creative Note |
|---|---|---|---|---|
| Age 18 to 24 | Around 15.8% | Growing | Individual and freemium plans | Shorts-first, fast hooks |
| Age 25 to 34 | Around 21.7% | Stable, largest group | Team plans and practitioner buyers | Tutorials and workflow demos |
| Age 35 to 44 | Around 18.5% | Stable | Budget holders and managers | Case studies and comparisons |
| Age 45 to 54 | Around 14% | Slow growth | Senior approvers | Connected TV and long-form |
| Age 55 plus | 9% to 10% | Fastest growth | Executive sign-off | Podcast and interview formats |
| Gender split | 53% male, 47% female | Slowly balancing | Category dependent | Test creative by segment, not assumption |
| Device: mobile | 63% to 70% of watch time | Declining share | Early research stage | Vertical framing, readable text |
| Device: television | Around 60% in the US | Rising fast | Awareness and trust | Sound design, wider shots |
Note that mobile and television percentages measure different things. Mobile share refers to global watch time. The 60% television figure applies to American watch time specifically. Mixing them produces figures above 100%, which we see in published roundups more often than you would hope.
Why Software Buyers Treat YouTube as a Search Engine
Now the part that matters most for a SaaS audience. Video is no longer a brand exercise in software buying.
Around 70% of business buyers watch video during a purchase decision. Some 96% say they prefer video when learning about products. And 72% report that vendor video shapes their shortlist.
Buying behaviour has shifted underneath that. Roughly 67% of business buyers now prefer a purchase process without a sales representative. Around 45% used AI tools during their most recent purchase.
YouTube processes close to 3 billion searches a month, which keeps it second only to Google. More than 60% of shoppers research products there before buying.
Some numbers on the marketer side too:
Reported returns average roughly $4 to $5 for every dollar of YouTube ad spend.
One counterpoint worth respecting. LinkedIn overtook YouTube as the most-used video platform among business marketers, reaching 70% usage against YouTube's 40% for distribution. That does not make YouTube weaker.
It makes the two complementary, since B2B SaaS video marketing needs both a feed and a searchable library.
The SaaSGoodies view: Video length is where we see most SaaS channels lose. Educational content performs best between five and ten minutes. Product pages convert best with one to three minute demos. Yet teams keep publishing 18-minute walkthroughs nobody finishes.
Our rule with clients: one searchable long-form asset per buying question, one 60-second cut for the site, one Short for the feed. Three assets, one shoot, three funnel stages covered.
AI on YouTube in 2026: Adoption Figures Worth Knowing
AI moved from experiment to infrastructure on this platform faster than most people noticed.
More than 1 million channels now use YouTube's AI creation tools every day. Around 20 million people used the platform's Ask feature within a single month. Some 6 million daily viewers watch at least ten minutes of auto-dubbed content.
Auto-dubbing itself now covers 27 languages and no longer requires Partner Program membership. That single change opens international reach to any channel, which reshapes how we plan localisation for clients.
Planned additions this year include Shorts generated with a creator's own likeness and games produced from text prompts. Music tools and image posts inside the Shorts feed are also coming.
Quality control got attention as well. YouTube removed 16 low-quality AI channels holding 4.7 billion combined views, part of a stated push against automated content farms.
Our projection on this: Auto-dubbing adoption is the most underrated growth lever available to SaaS channels right now. We estimate that by late 2027, over 35% of watch time on English-language software channels will come from dubbed audio tracks.
The cost of that reach is currently zero. We already switch it on by default for every client channel we manage, and non-English watch time has climbed in every account where we did.
YouTube Against Rival Video Platforms in 2026
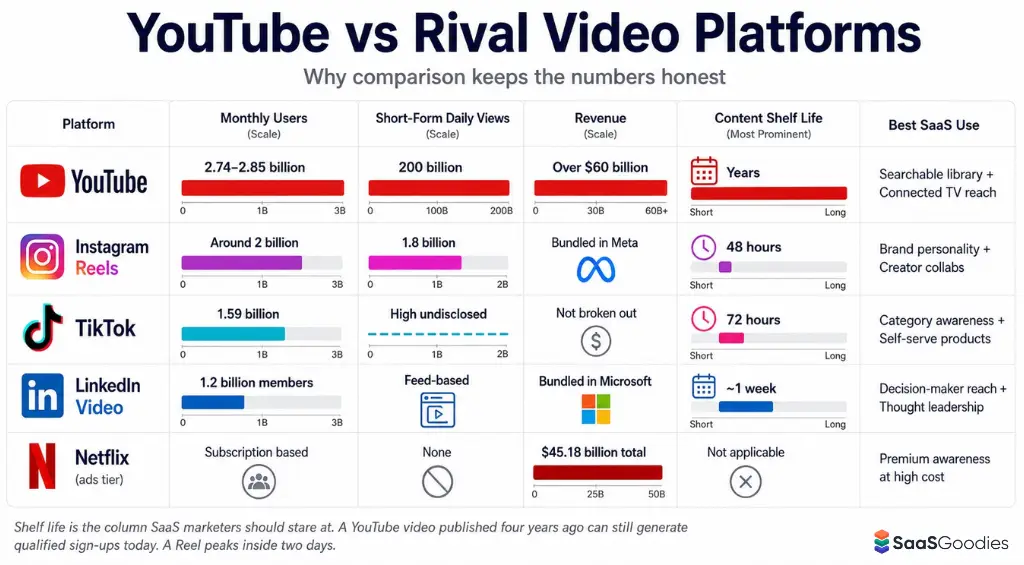
Comparison keeps the numbers honest. Here is how the main video surfaces stack up this year.
| Platform | Monthly Users | Short-Form Daily Views | 2025 Ad or Total Revenue | Content Shelf Life | Best SaaS Use |
|---|---|---|---|---|---|
| YouTube | 2.74 to 2.85 billion | 200 billion | Over $60 billion total | Years, search-driven | Searchable library plus connected TV reach |
| Instagram Reels | Around 2 billion | Around 1.8 billion users monthly | Bundled inside Meta | Around 48 hours | Brand personality and creator collaborations |
| TikTok | Around 1.59 billion | High, undisclosed | Not broken out | Around 72 hours | Category awareness for self-serve products |
| LinkedIn video | Around 1.2 billion members | Feed-based | Bundled inside Microsoft | Around one week | Decision-maker reach and thought leadership |
| Netflix (ads tier) | Subscription based | None | $45.18 billion total | Not applicable | Premium awareness at high cost |
Shelf life is the column SaaS marketers should stare at. A YouTube video published four years ago can still generate qualified sign-ups today. A Reel peaks inside two days.
That difference explains why we treat YouTube as an owned asset library rather than a social feed. Search demand compounds. Feed reach does not.
Our Own YouTube Benchmarks for SaaS Channels
Public benchmarks cover advertising well and organic channels badly. So these are the targets we use internally, drawn from channels we run and audit.
That final point causes the most friction in client kick-offs. YouTube is a slow channel that becomes a cheap channel. Teams expecting paid-search timelines abandon it around month four, right before compounding starts.
Conflicting YouTube Numbers, and Which Ones We Trust
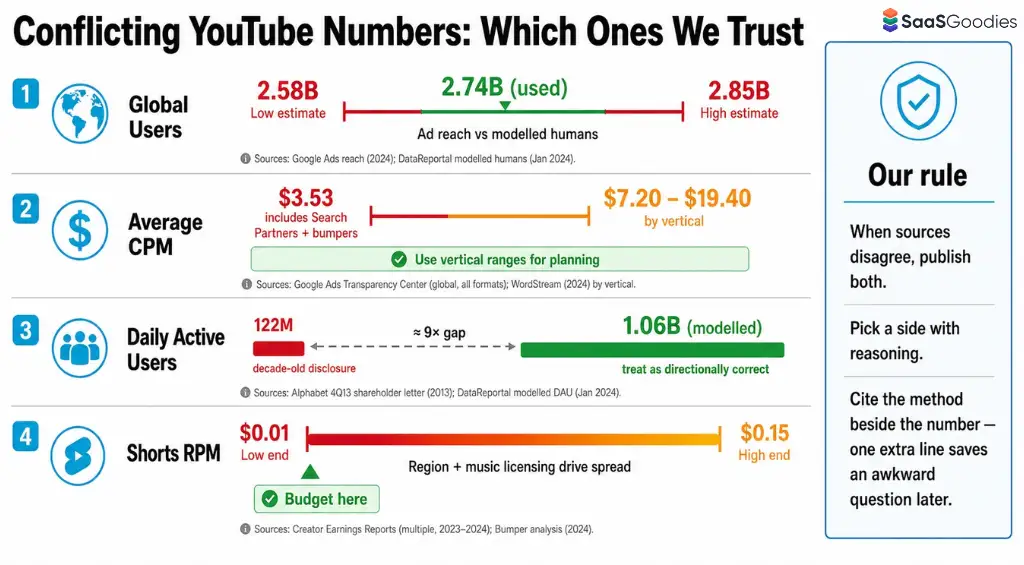
Statistics posts rarely admit when sources disagree. Ours does, because these gaps change decisions.
Global user totals. Reported figures run from 2.58 billion to 2.85 billion. Ad reach counts targetable accounts. Monthly active counts modelled humans. We use 2.74 billion and label the method.
Average CPM figures. Some sources quote $3.53 across all industries. Others report $7.20 to $19.40 by vertical. The low figure usually includes Search Partner inventory and bumper impressions. For planning, use vertical ranges.
Daily active users. The 122 million figure and the 1.06 billion figure differ by almost a factor of nine. One is a decade-old disclosure. Treat the higher modelled number as directionally right.
Shorts RPM ranges. Ranges run from $0.01 to $0.15. Region and music licensing explain most of it. Budget at the low end.
Where we land on this: When two credible sources disagree, we publish both and pick a side with reasoning. Silently choosing the flattering number is how bad benchmarks spread through an industry. If you cite these YouTube Statistics in a deck, cite the method alongside the number. It takes one extra line and saves an awkward question later.
FAQs on YouTube Statistics for 2026
How many people use YouTube in 2026?
Between 2.70 and 2.85 billion people use YouTube monthly, with 2.74 billion the most commonly modelled figure. Potential advertising reach sits lower at around 2.58 billion, because that counts targetable accounts rather than individual viewers.
How much revenue did YouTube generate?
YouTube passed $60 billion in total revenue in 2025. Advertising delivered $40.37 billion and subscriptions contributed roughly $19.6 billion. We project $67 billion to $70 billion for 2026.
How many daily views does YouTube Shorts get?
Shorts averages 200 billion views per day in 2026, up from roughly 70 billion two years earlier. Around 2 billion people use Shorts monthly, making it the largest short-form format worldwide.
What does a YouTube ad cost for a SaaS company?
Expect $5 to $15 CPM on skippable in-stream and $18 to $32 on connected TV. Cost per view for software campaigns runs $0.04 to $0.25 depending on format and audience quality.
Is YouTube bigger than Netflix?
Yes, on both revenue and television viewing time. YouTube cleared $60 billion against Netflix's $45.18 billion, and holds around 13% of American TV viewing against roughly 8% for Netflix.
Do B2B buyers actually watch video?
Around 70% of business buyers watch video during a purchase decision, and 72% say vendor video influences their shortlist. Some 96% prefer video when learning how a product works.
How much do YouTube Shorts pay creators?
Most creators earn $0.01 to $0.07 per thousand Shorts views through the pooled revenue model, keeping 45% of their share. Long-form pays $3 to $12 per thousand views, so Shorts works better as a growth tool.
What We Expect Next: Our 2026 to 2027 Projections
Time to put our own numbers down. These are editorial calls, based on the data above plus channels we manage daily.
The short version. YouTube stopped being a social platform and became media infrastructure. Growth in users has cooled, growth in attention has not, and growth in revenue per viewer is accelerating.
For a SaaS marketer, that reframes the decision entirely. YouTube is no longer a social channel line item. It is a media-mix decision, sitting next to search and television rather than beneath them.
Our advice after running this channel for a decade stays simple. Build a searchable library around real buying questions. Use Shorts to recruit, long-form to convince, and connected TV to make senior buyers feel like they already know you. Then give it nine months before you judge it.
These YouTube Statistics will shift again through the year, and we will update this page whenever primary sources publish new counts. If you spot a figure that has moved, tell us and we will verify it.

Sources
- Alphabet Investor Relations, quarterly and annual results
- Alphabet, Fourth Quarter and Fiscal Year 2025 Results
- YouTube Blog, Neal Mohan's 2026 letter
- DataReportal, Essential YouTube Statistics
- Statista, YouTube audience size by country
- Nielsen, The Gauge and Media Distributor Gauge
- eMarketer, Worldwide YouTube Forecast Overview 2026
- Pew Research Center, Social Media Fact Sheet
- Wyzowl, State of Video Marketing
- Variety, YouTube full-year revenue coverage
- Tubefilter, Alphabet earnings and YouTube revenue
- YouTube Help, Partner Program eligibility requirements