B2B SaaS Marketing Statistics 2026: Data Shaping Budgets

B2B SaaS marketing got pricier and weirder in 2026. Buyers now open ChatGPT before they open Google. Acquisition costs crept up again. Retention quietly turned into the real growth engine while everyone was staring at ad dashboards.
We've tracked these numbers across the programmes we run and audit, and the story keeps repeating: owned channels compound, paid channels leak, and AI search picks who makes the shortlist. Below are the B2B SaaS marketing statistics that actually move budgets right now, with our own calls on where each metric lands by year-end.
The market is huge, and that's exactly why marketing hurts
Let's set the table. The money is flowing. Competition for a slice of it is brutal.
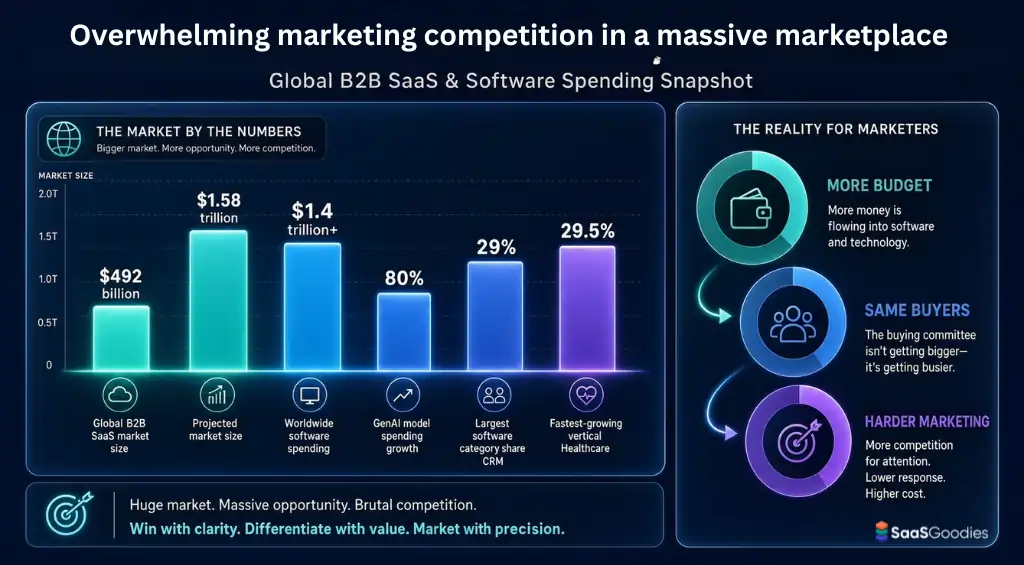
Global B2B SaaS crossed roughly $492 billion in 2026, on a path toward $1.58 trillion by 2031. Worldwide software spending climbed 14.7% year on year, pushing past $1.4 trillion. That makes software the second-fastest-growing line in all of IT.
Generative AI is the accelerant. Spending on GenAI models alone grew close to 80% in a single year. Nearly every software category now ships an AI feature, so buyers expect one.
Here's the trap, though. A growing market does not hand you growth. More budget chases the same in-market buyers. Marketing gets harder precisely because the pie got bigger and louder.
| Market metric (2026) | Figure | What moved |
|---|---|---|
| Global B2B SaaS market size | $492 billion | Up from $390 billion in 2025 |
| Projected market size by 2031 | $1.58 trillion | 26.24% annual growth rate |
| Worldwide software spending | $1.4 trillion+ | +14.7% year on year |
| GenAI model spending growth | 80% | Fastest-rising software sub-segment |
| Largest software category share | CRM at 29% | Still the biggest single slice |
| Fastest-growing vertical | Healthcare (29.5%) | Vertical SaaS pulling ahead |
SaaSGoodies call: we expect worldwide software spending growth to hold in the mid-teens through 2026 rather than slow. AI feature demand keeps pulling budgets forward, so the “growth is over” crowd will be wrong again this year.
Where buyers actually start now (spoiler: not your homepage)
This is the single biggest change we've clocked in a decade of watching SaaS funnels.
Buyers moved their research into AI chat. 51% of B2B software buyers now begin vendor research inside an AI chatbot more often than Google. A year earlier, that figure sat at 29%. A 22-point jump in twelve months is not a trend, it's a stampede.
It gets starker. Around 71% of B2B SaaS buyers say they rely on AI chatbots at some point when researching software. And 94% of buyers used a large language model somewhere in their buying journey.
The scale numbers back it up. ChatGPT went from 400 million weekly users in early 2025 to a billion monthly users by early 2026. Referral traffic from AI tools grew more than 500% year on year.
Now the kicker for anyone still married to blue links. When a Google AI Overview shows up, the position-one result loses about 58% of its clicks. Your top-of-funnel content is exposed. Your homepage is being skipped.
So who gets picked? Brands that get cited inside the answer. That's answer engine optimisation doing the heavy lifting now, and most teams are late to it.
| AI search stat (2026) | Figure | Why it stings |
|---|---|---|
| Buyers starting research in AI chatbot | 51% | Up from 29% a year earlier |
| B2B SaaS buyers using AI for software research | 71% | Absence from answers = pipeline risk |
| Buyers using an LLM in the buying journey | 94% | Nearly universal now |
| Position-one CTR drop under AI Overviews | 58% | Rankings mean less than citations |
| B2B SaaS teams tracking AEO citations | 48% | Up from 11% in early 2025 |
| AI-referred traffic conversion vs organic | 5.8% vs 4.9% | AI pre-qualifies the click |
Here's the gap we love pointing out. Buyers moved fast. Marketers did not. Only about 48% of B2B SaaS companies track if AI tools cite them, even though most buyers now research there. That measurement hole is a first-mover gift.
SaaSGoodies call: we think AEO citation tracking crosses 60% of B2B SaaS teams by the end of 2026. The teams building comparison tables, year-stamped stats, and FAQ pages now will own the citations before the rest wake up.
Customer acquisition cost: one number won't save you
Everyone wants a single customer acquisition cost figure. There isn't one. The spread is the story.
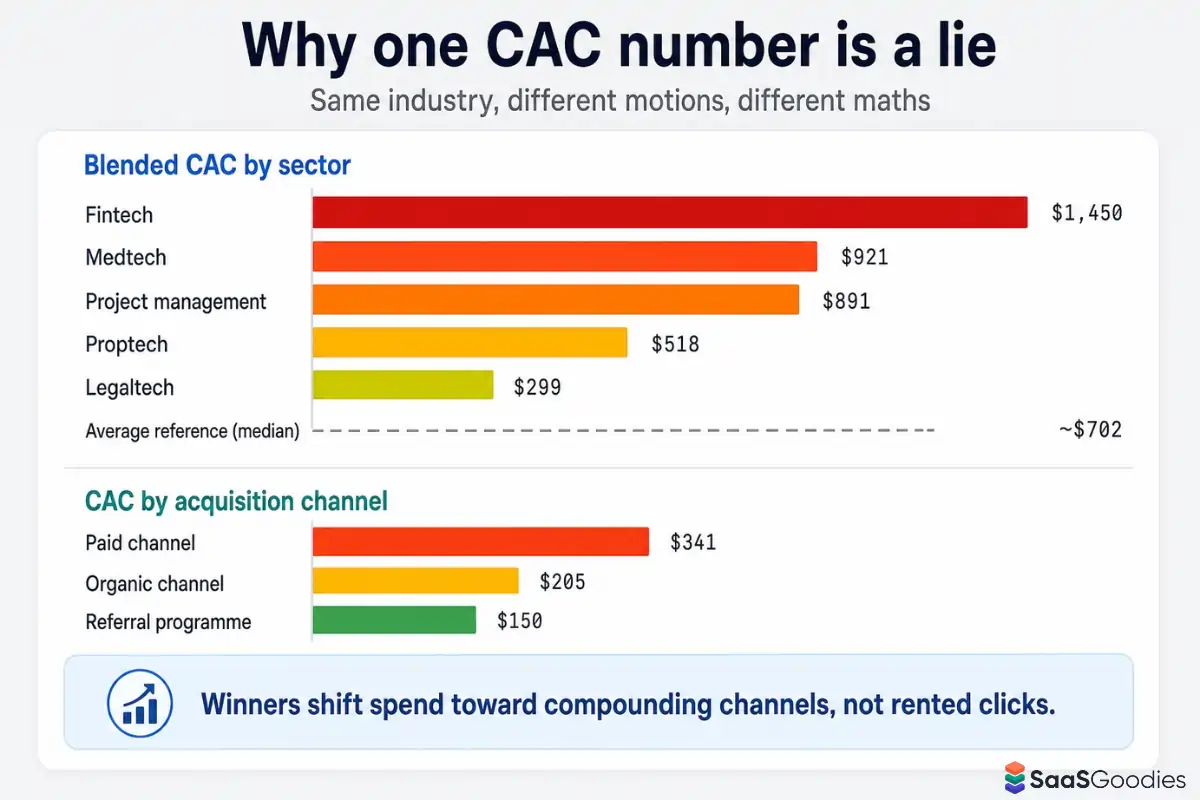
Depending on how you count, blended B2B SaaS CAC lands anywhere from roughly $239 to $702 to $1,200. Those aren't contradictions. They measure different motions.
A self-serve, product-led motion can post CAC under $700 with payback inside 7 to 11 months. A field-sales enterprise motion routinely runs $5,000 to $14,000 per customer with 18 to 24 month payback. Same industry, wildly different maths.
By sector, the swing is about 5x. Fintech tops the chart at roughly $1,450 per customer. Medtech follows near $921, project management around $891. On the cheap end sit proptech ($518) and legaltech ($299).
There's a harder truth buried in the ARR figures. Median CAC now sits around $2.00 spent to win $1.00 of new annual recurring revenue, up 14% from 2023. The weakest quartile burns $2.82 per dollar of new ARR. That's a payback problem, not a spend problem.
| CAC benchmark (2026) | Figure | Notes |
|---|---|---|
| Fintech CAC | $1,450 | Highest tracked sector |
| Medtech CAC | $921 | Second highest |
| Project management CAC | $891 | Third |
| Proptech CAC | $518 | Among the lowest |
| Legaltech CAC | $299 | Lowest tracked sector |
| Organic channel CAC | $205 | Roughly 40% cheaper than paid |
| Paid channel CAC | $341 | Google, LinkedIn, paid social |
| Referral programme CAC | $150 | Most cost-efficient channel |
| Blended CAC payback | 18 months | Up from 12 to 15 months in 2023 |
Notice the channel split. Organic acquisition costs around $205 per customer. Paid runs closer to $341. Referrals are cheapest at roughly $150. That's why smart teams keep feeding owned channels even when the paid dashboard looks tempting.
SaaSGoodies call: we expect blended B2B SaaS CAC to nudge past $760 by year-end as paid CPLs keep inflating. Payback periods stay stubborn near 18 months. The winners will be the ones who shift spend toward compounding channels instead of renting more clicks.
Channel ROI: rented reach versus owned reach
Now the fun part, where the returns split hard.
Organic search keeps printing the best long-term numbers. SEO averages around 702% ROI for B2B SaaS over a three-year window, breaking even near seven months. Organic search alone drives close to 44.6% of all B2B revenue, making it the single largest revenue channel.
Email refuses to die. It returns roughly £36 to £40 per pound spent, and 42% of marketers rank it their most effective channel, ahead of social and paid search. Behaviour-triggered sequences beat static drips every time we test them.
Paid is where the story soured. LinkedIn ad costs rose about 24% year on year. Google Ads costs climbed roughly 19%. Yet LinkedIn ROI (113%) now edges out Google Ads (78%) for B2B SaaS, so channel choice matters more than raw spend.
The pipeline mix tells the whole tale. Paid acquisition's share of median B2B SaaS pipeline fell from 34% in 2023 to 26% in 2026. Organic, content, and AEO combined climbed from 22% to 27%. At top-quartile teams, owned channels now source 41% of qualified pipeline.
| Channel (2026) | ROI / performance | Read |
|---|---|---|
| SEO / organic search | 702% three-year ROI | Break-even near 7 months |
| Email marketing | £36 to £40 per £1 | 42% call it most effective |
| LinkedIn Ads | 113% ROI | Now beats Google Ads |
| Google Ads | 78% ROI | Costs up 19% year on year |
| Content marketing | 844% three-year ROI | Compounds after 12 to 18 months |
| Paid pipeline share | 26% (was 34% in 2023) | Shrinking fast |
| Organic + content + AEO share | 27% (was 22%) | Now the bigger slice |
Content deserves its own nod. Around 90% of B2B SaaS companies run content marketing, and three-year content ROI reaches roughly 844%. The catch: 97% outsource at least one piece of the work because internal teams can't keep pace.
SaaSGoodies take: if you only fund bottom-of-funnel capture, you're fishing in a shrinking pond. Buyers build their shortlist before they ever hit a demo form. Owned media puts you on that list. Paid just re-targets people who already decided.
Funnel conversion: the leak that costs the most
You can pour buyers in the top all day. If the middle leaks, you're just heating the room.
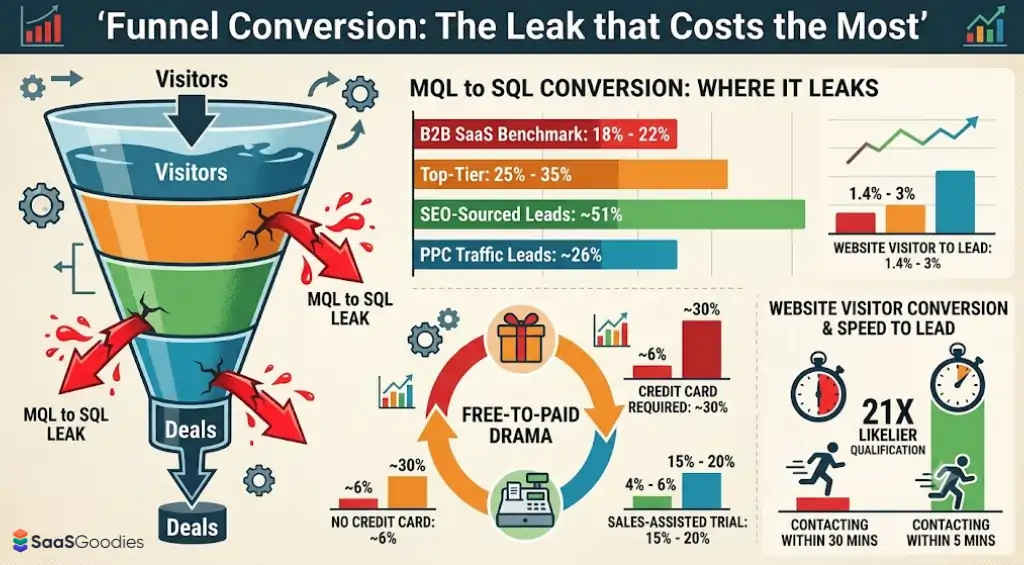
The classic bottleneck sits at MQL to SQL conversion. The cross-industry average limps along near 13%. For B2B SaaS specifically it runs higher, roughly 18% to 22%, with top performers hitting 25% to 35%.
Channel quality decides the slope. SEO-sourced leads convert to SQL at about 51%. PPC traffic manages roughly 26%. Same funnel, double the yield, purely from source.
Free trials are their own drama. The median free-to-paid conversion rate across 200 B2B products sits around 8%. But credit-card-required trials convert near 30%, roughly five times better than no-card trials. Self-serve trials average 4% to 6%, while sales-assisted motions reach 15% to 20%.
Website conversion holds around 2% to 3%. Speed to lead is the cheapest fix nobody applies. Contacting a web lead within five minutes rather than thirty makes qualification about 21 times more likely.
| Funnel stage (2026) | Benchmark | Top-tier |
|---|---|---|
| Visitor to lead | 1.4% to 3% | Higher with tight message match |
| MQL to SQL (B2B SaaS) | 18% to 22% | 25% to 35% |
| MQL to SQL by SEO | 51% | Best-converting source |
| MQL to SQL by PPC | 26% | Volume over quality |
| SQL to close | 20% to 25% | 30%+ |
| Free-to-paid (no card) | 6% | Credit-card trials 30% |
| Self-serve trial to paid | 4% to 6% | Sales-assisted 15% to 20% |
| Demo to opportunity | 60% to 80% | Elite teams 90%+ |
Here's the maths that changes budgets. A five-point lift at the MQL-to-SQL stage flows through to roughly 18% more revenue. Lifting website conversion from 2% to 3% can cut CAC by 25% to 40%. Small funnel wins beat giant traffic wins almost every time.
SaaSGoodies call: we think credit-card-required trials become the default for self-serve SaaS by end of 2026. The 5x conversion gap is too large to ignore, even at the cost of fewer top-line signups.
Retention is the growth lever everyone underfunds
If 2023 was growth-at-all-costs, 2026 is keep-what-you-caught. And the data agrees.
Net revenue retention became the metric investors stare at. Median NRR across B2B SaaS sits near 106%, with top performers past 120%. Companies holding 110%+ NRR grow about 2.3 times faster than peers stuck at 95% to 100%.
Gross retention tells the floor. Median GRR lands around 90%, meaning the typical SaaS keeps 90% of existing revenue before any expansion. Annual churn hovers near 3.5%, split between voluntary and involuntary.
Churn scales with size. Enterprise SaaS above $50 million ARR averages roughly 0.7% monthly logo churn. Mid-market runs closer to 1.3%. SMB-heavy products bleed near 4.1% a month, which is why SMB SaaS lives or dies on activation.
Pricing shifted too. Usage-based pricing now appears in about 51% of public SaaS companies, up from 27% in 2021. Pure subscription is no longer the default model.
| Retention metric (2026) | Figure | Signal |
|---|---|---|
| Median net revenue retention | 106% | Top performers 120%+ |
| NRR growth advantage | 2.3x faster | At 110%+ NRR vs 95 to 100% |
| Median gross revenue retention | 90% | Before expansion |
| Annual B2B SaaS churn | 3.5% | 2.6% voluntary, 0.9% involuntary |
| Enterprise monthly logo churn | 0.7% | $50M+ ARR |
| SMB monthly logo churn | 4.1% | Activation decides survival |
| Usage-based pricing adoption | 51% of public SaaS | Up from 27% in 2021 |
The point we hammer with clients: expansion revenue from existing accounts is cheaper than any new logo. Marketing that ignores lifecycle and onboarding is leaving the easiest ARR on the table.
SaaSGoodies call: we expect usage-based pricing to reach 55% of public SaaS by year-end. Expansion-led growth keeps outpacing new-logo growth, so customer marketing budgets rise while pure acquisition spend flattens.
Marketing budgets: how much, and where it goes
Time for the question every board asks and nobody answers cleanly.
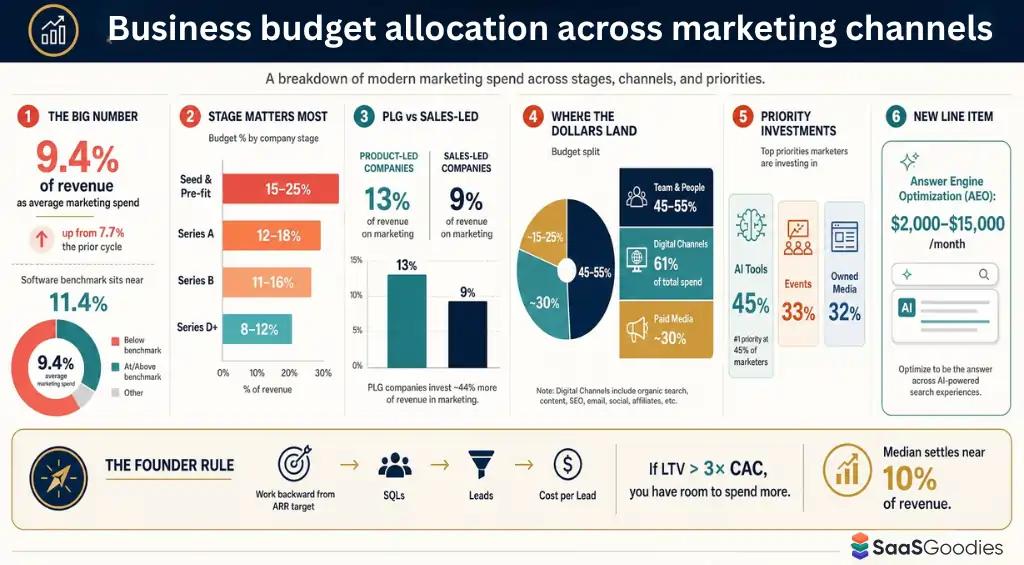
Average marketing spend sits near 9.4% of revenue heading into 2026, up from 7.7% the year before. Software specifically runs hotter, closer to 11.4% at the Gartner benchmark. Around 83% of B2B marketing leaders plan a budget increase this year.
Stage matters far more than any industry average. Seed and pre-fit SaaS often push 15% to 25% of ARR. Series A sits near 12% to 18%, Series B around 11% to 16%, and mature Series D and beyond settles at 8% to 12%.
Product-led companies spend differently. PLG firms average about 13% of revenue on marketing versus 9% for sales-led teams, since more of the budget goes into product, tooling, and activation.
Where do the dollars actually land? Here's the split we see most often across the accounts we review:
There's a fresh line item too. Answer engine optimisation budgets, running roughly $2,000 to $15,000 a month, barely existed in 2024 plans. In 2026 they're turning standard, because a budget with no AI-search allocation guarantees you sit outside the answers buyers read first.
We keep telling founders to stop copying percentages off a blog and start with pipeline maths. Work backward from your ARR target to SQLs, then to leads, then to cost per lead. A defensible number survives a CFO. A copied benchmark does not.
If your customer lifetime value sits comfortably above three times your CAC, you likely have room to spend more. Below that line, fix efficiency first before you pour in another dollar.
SaaSGoodies call: we think the median settles near 10% of revenue by year-end, but the real shift is inside the line items. AI tooling and AEO become permanent budget lines, not experiments. Teams that still run zero AEO spend enter 2027 invisible.
What the buying committee looks like in 2026
One more number that reframes everything above. Deals are group decisions now.
The median B2B buying committee sits around 11.2 stakeholders for deals over $50,000, up from 9.7 in 2024. More people means longer cycles, roughly 121 days for mid-market and 218 days for enterprise.
Most of the decision happens before you're in the room. Buyers self-educate through about 67% of the journey before any vendor conversation. And in 95% of purchases, the winner was already on the buyer's day-one shortlist.
So the job of modern B2B SaaS marketing statistics work isn't just lead capture. It's getting cited, reviewed, and shortlisted before a form ever loads. Review-site presence matters here: G2 accounts for a big share of software citations inside AI answers, and comparison content gets cited far more than plain prose.
Larger committees also change what content you need. Each stakeholder wants a different proof point. The economic buyer wants ROI maths. The technical evaluator wants integration detail.
The end user wants a demo they can trust. One generic landing page can't feed all three, which is why teams that map content to committee roles pull ahead. We've watched that single shift lift close rates more than any bidding tweak.
Which content formats pull their weight in 2026
Content adoption is basically universal. Roughly 90% of B2B SaaS companies run a content programme. The gap isn't strategy, it's capacity, which is why about 97% now outsource at least one piece of the data-driven content work.
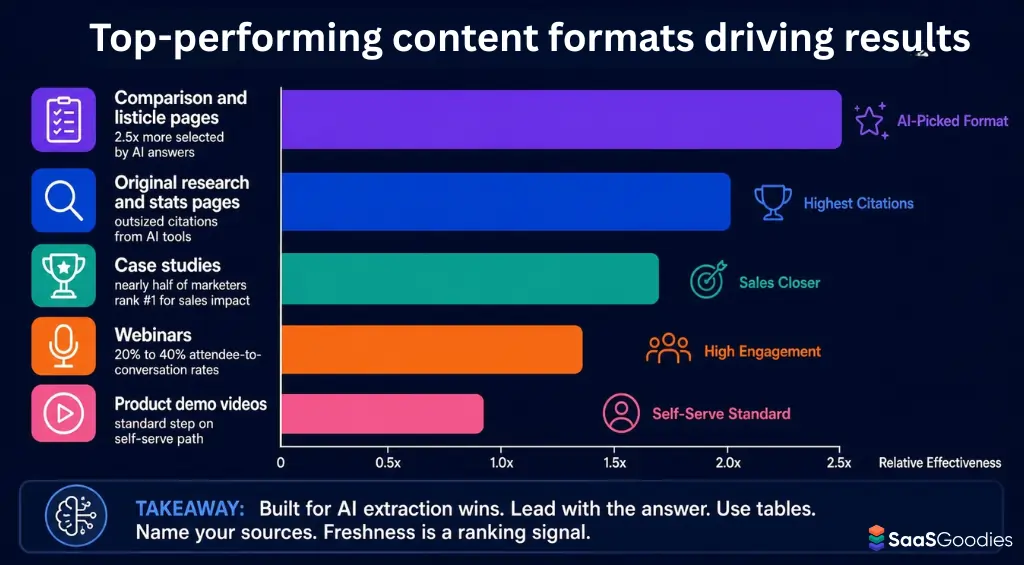
But not all formats earn their keep. Here's what we see converting and getting cited:
The format lesson for 2026 is blunt. Content built for keyword matching is a different product from content built for AI extraction. Lead with a direct answer. Add tables. Stamp the year. Name your sources. Buyers, and the models they ask, reward it.
SaaSGoodies take: if you refresh your top statistics and comparison pages every month, you stay cited. Let them go stale and the models quietly swap you out. Freshness is now a ranking signal, not a nicety.
Our honest read on 2026
We've written a lot of stats posts. Here's what we'd actually act on this year, in plain terms.
Paid still works, but it's a capture tool, not a growth engine. Fund it for demand you already created. Don't expect it to create demand cheaply, because CPLs keep climbing.
AI search is not next year's problem. Buyers already movmarketing budgeted. Build citation-worthy content now: year-stamped numbers, comparison tables, direct-answer intros, and a real presence on review platforms.
Retention beats acquisition on cost every single time. Onboarding, activation, and expansion deserve marketing budget, not just a customer-success line item.
And measure the funnel middle. The MQL-to-SQL leak costs more than any top-of-funnel weakness. Fix the leak before you buy more traffic.
That's the game in 2026. Fewer vanity metrics, more compounding assets, and a serious answer to the “where do buyers start” question. None of these B2B SaaS marketing statistics live in a vacuum, so treat them as a starting benchmark, then tune against your own ACV, motion, and margins. The numbers above are the ones we're betting on.
FAQ
What is the average B2B SaaS CAC in 2026?
Blended B2B SaaS customer acquisition cost lands roughly between $239 and $702, though it stretches past $1,200 for enterprise motions. Sector matters most: fintech runs near $1,450 while legaltech sits close to $299.
How many buyers use AI to research software now?
Around 51% of B2B software buyers start research in an AI chatbot more often than Google, and about 94% use a large language model somewhere in the buying journey.
What's a good MQL-to-SQL conversion rate for SaaS?
The cross-industry average is near 13%, but B2B SaaS runs higher at 18% to 22%. Top performers reach 25% to 35%, largely by fixing lead quality and channel mix.
What free-to-paid conversion rate should I expect?
The median free-to-paid conversion rate across B2B products is around 8%. Credit-card-required trials convert near 30%, roughly five times better than no-card trials.
How much should a B2B SaaS spend on marketing?
It depends on stage. Seed companies often spend 15% to 25% of ARR, while mature Series D and beyond settle near 8% to 12%. The average across B2B SaaS sits close to 9.4% of revenue.
Is SEO still worth it in 2026?
Yes. SEO averages roughly 702% three-year ROI with a seven-month break-even, and organic search drives close to 44.6% of all B2B revenue. It just has to be built for AI citation, not only rankings.
What is the biggest shift in B2B SaaS marketing this year?
Buyer research moved into AI chat, and answer engine optimisation became a baseline requirement. Brands cited inside AI answers make the shortlist; brands absent from them are effectively invisible.
Sources
- Mordor Intelligence, B2B SaaS Market Size & Growth Report 2026 to 2031
- Gartner, Worldwide IT & Software Spending Forecast
- First Page Sage, SEO ROI Statistics 2026 & B2B CAC by Industry
- G2, The Answer Economy: B2B Buyer Behaviour Report
- 6sense, B2B Buyer Experience Research
- HubSpot, State of Marketing
- Salesforce, State of Marketing Report
- ChartMogul, SaaS Retention Report
- KeyBanc Capital Markets, SaaS Survey
- Bessemer Venture Partners, State of the Cloud
- Litmus, Email Marketing ROI Research
- Ahrefs, AI Search & SEO Traffic Study
- Statista, SaaS & Software Market Data
- DataReportal, Digital & Search Behaviour Reports
- Edelman / LinkedIn, B2B Thought Leadership Impact Report