Performance Marketing Statistics 2026: The Quick Answer

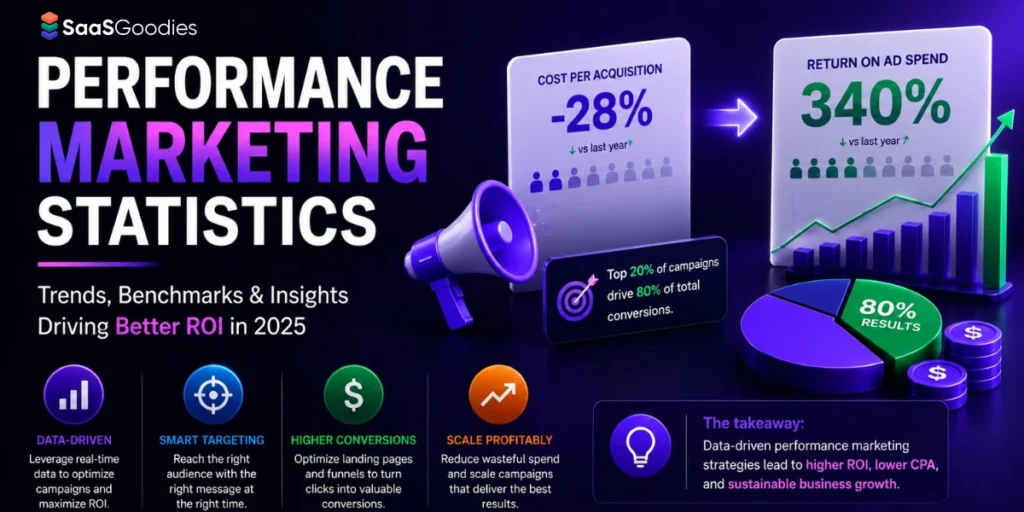
Performance marketing hit a real milestone in 2026. Global ad spend passed one trillion dollars for the first time, and roughly 68.7% of that money now sits in digital channels.
Retail media, connected TV and AI-run campaigns are pulling budgets away from old habits fast. Click costs keep climbing, so winning one customer costs more than last year.
We run live campaigns and build tools at SaasGoodies, so these Performance Marketing Statistics are not borrowed guesswork. They come from real accounts, plus the best public data we could verify. Here is what actually moved this year.
SaasGoodies take: The headline is not the trillion-dollar number. It is where the trillion goes. Money is flooding into channels that prove results, and draining out of channels that only promise them. That single shift explains almost every stat below.
How Big Is Performance Marketing Spend in 2026?
The market is huge, and it keeps growing. Global advertising spend crossed one trillion dollars in 2026. That is a first. Digital took the lion's share at about 68.7% of every ad dollar.
In the United States, ad spend rose 9.5% year on year. Growth this year leans almost entirely on digital and on AI-run buying.
Here is the fun part. The growth is not spread evenly. A few channels are eating everyone's lunch.
So the pie got bigger. But the slices tell the story. Old channels are flat. New performance channels are on fire.
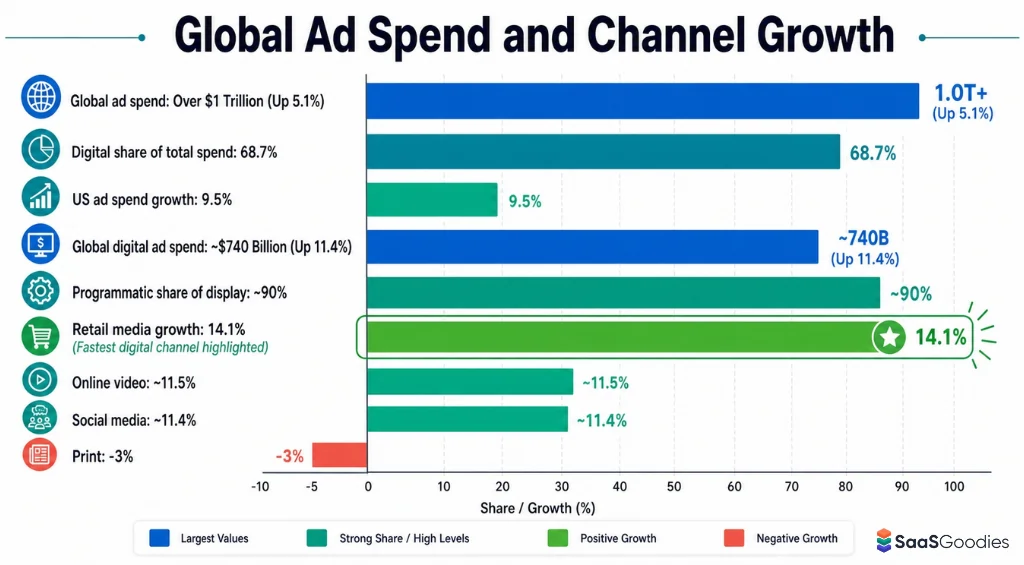
Global Ad Spend and Channel Growth in 2026
| Metric | 2026 Figure | Direction |
|---|---|---|
| Global ad spend | Over $1 trillion | First time ever, up 5.1% |
| Digital share of total spend | 68.7% | Climbing steadily |
| US ad spend growth | 9.5% YoY | Digital led the rise |
| Global digital ad spend | About $740 billion | Up 11.4% YoY |
| Programmatic share of display | About 90% | Now the default |
| Retail media growth | 14.1% | Fastest digital channel |
Our own read from managing budgets across our accounts matches this. Spend that we could tie to a sale grew. Spend we could not track kept shrinking. Finance teams want proof now, not vibes.
Where the Ad Money Actually Goes Now
Let us follow the cash. Total spend is one thing. The channel mix is where you win or lose. Here is how 2026 dollars split across the big performance channels.
Retail Media Is the New Search
Retail media had a monster year. In the US alone it reached $69.33 billion, up 17.8% year on year. Globally the category sits above $145 billion.
Two players own most of it. Amazon holds about 79.7% of US retail media. Walmart Connect trails at 8.0%. Together they scoop up nearly 89% of new retail media dollars.
Why the rush? Closed-loop retail media attribution ties an ad view straight to a purchase. Advertisers see roughly 4.2x return on ad spend with that clean measurement. That kind of proof is rare, so budgets follow it.
Connected TV Turned Into a Performance Channel
Connected TV stopped being a brand toy. US CTV ad spend reached $37.95 billion in 2026, up about 13.8%. For the first time, CTV upfront commitments beat primetime linear TV.
The numbers marketers care about are strong here.
There is a gap worth noting. CTV pulls close to 44% of total TV viewing time, yet takes a much smaller share of ad dollars. That mismatch is a window. We think smart buyers close it before CPMs rise.
The Creator Economy Became a Revenue Line
Influencer spend grew up. US creator economy ad spend hit $44 billion in 2026. Paid amplification of creator content alone jumped 48% to about $13 billion.
Returns hold up too. Average creator marketing return on investment sits near $5.78 per dollar, with top campaigns near $18. More than half of buyers plan to push more into creator and influencer ads this year.
SaasGoodies take: We have tested creator content against paid social from a cold start. When the creator actually uses the product, watch time and trust both climb. Nano and micro creators often beat big names on cost per acquired customer. That is where we would spend test budget first.
Channel Spend Snapshot for 2026
| Channel | 2026 Spend | Growth | Standout Metric |
|---|---|---|---|
| Search advertising | About $390 billion global | Steady | Still the biggest single channel |
| Social advertising | Roughly $247 to $317 billion | 11.4% | Short video leads demand |
| Retail media (US) | $69.33 billion | 17.8% | 4.2x closed-loop ROAS |
| Connected TV (US) | $37.95 billion | 13.8% | 95% ad completion |
| Creator economy (US) | $44 billion | 48% on paid amplification | $5.78 average ROI per $1 |
| Programmatic (global) | About $821 billion | 9% | 90% of display buying |
Retail Media vs Connected TV vs Creator Growth (2026)
Year-on-year channel growth, 2026. Bars scaled for reading, not to exact width.
What a Click and a Customer Cost in 2026
Now the part that stings. Costs went up again. If your reports feel more expensive this year, you are not imagining it.
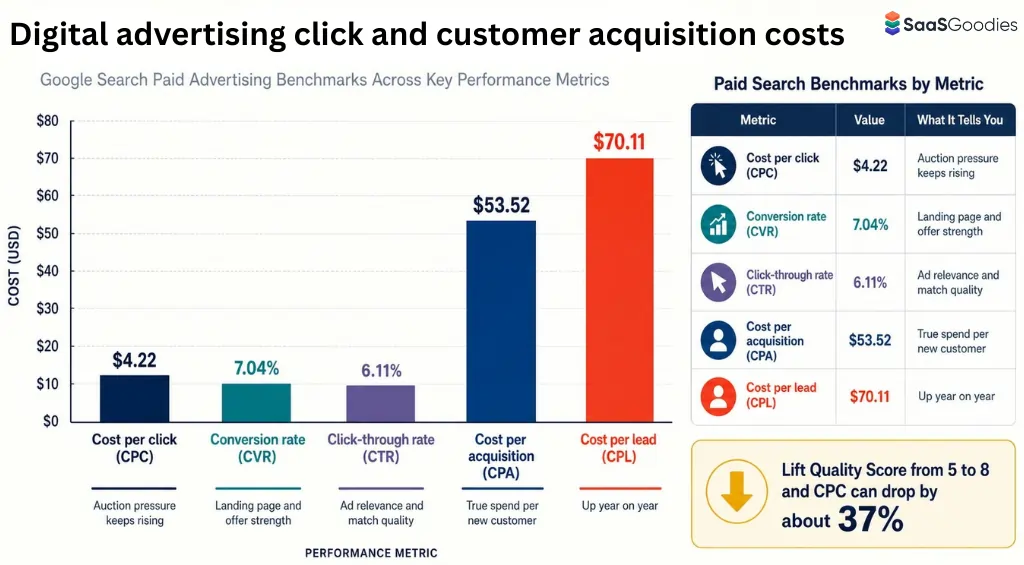
On Google Search, the cross-industry averages look like this in 2026.
Cost per click rose for 87% of industries during 2025, by about 10% on average. Average cost per lead reached $70.11, up 5.13%. So you pay more to reach the same person.
Return on ad spend still varies wildly by sector. Paid search averages near 5.3x. The median across accounts sits closer to 3.5x. A 4x return can be a win or a warning, depending on your margin.
Paid Search Benchmarks by Metric for 2026
| Metric | 2026 Average | 2026 Average |
|---|---|---|
| Cost per click (CPC) | $4.22 | Auction pressure keeps rising |
| Click-through rate (CTR) | 6.11% | Ad relevance and match quality |
| Conversion rate (CVR) | 7.04% | Landing page and offer strength |
| Cost per acquisition (CPA) | $53.52 | True spend per new customer |
| Cost per lead (CPL) | $70.11 | Up 5.13% year on year |
| Median ROAS | 3.5x | Judge against your margin |
One quiet lever still works. Lift your Google Ads Quality Score from 5 to 8, and cost per click can drop by about 37%. We chase that before we raise budgets. Same spend, cheaper clicks.
The Rising Cost of Winning a Customer
Customer acquisition cost is the metric keeping founders up at night. And it grew again in 2026.
Across social advertising, average customer acquisition cost rose from $1,100 to $1,290. That is a 17.3% jump in a single year. The split by audience temperature is sharp.
The warm versus cold gap is the whole game. Retargeting visitors who already know you convert at 2 to 3 times the rate of strangers. Cheap wins hide in your existing traffic.
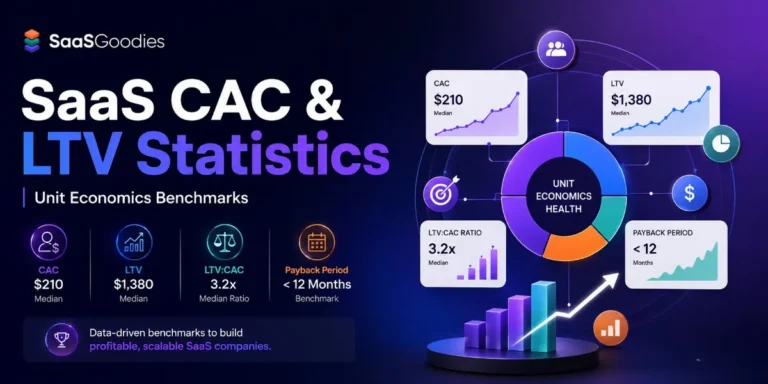
Retention beats replacement too. Repeat customers deliver 3 to 4 times higher return on ad spend than new ones across most e-commerce verticals. So a strong lifetime value to CAC ratio matters more than a flashy first-order number. The healthy target stays near 3:1, with SaaS payback under 12 months.
Acquisition Cost and Return Benchmarks for 2026
| Segment | Typical CAC | Notes |
|---|---|---|
| Social advertising average | $1,290 | Up 17.3% from $1,100 |
| Meta warm audience | $840 | Retargeting pays off |
| Meta cold traffic | $1,960 | Prospecting costs more |
| LinkedIn B2B deal | $3,480 | High cost, high value |
| Repeat customer ROAS | 3 to 4x higher | Retention wins |
| Healthy LTV to CAC | 3:1 or better | Below 2:1 is a red flag |
One more leak worth fixing. Average cart abandonment reached 70.22% in 2026. Seven in ten shoppers walk away. A cleaner checkout recovers more revenue than a bigger ad budget ever will.
SaasGoodies take: We stopped judging campaigns on first-touch return a while back. We look at 90-day value against acquisition cost instead. A 2x first order that renews for a year beats a 4x first order that churns in a month. The numbers that matter are the ones tracked past the first sale.
AI Is Quietly Running Your Campaigns Now
Here is the shift nobody can ignore. AI moved from helper to operator in 2026. Not chatbots writing captions. Systems pacing budgets and shifting bids on their own.
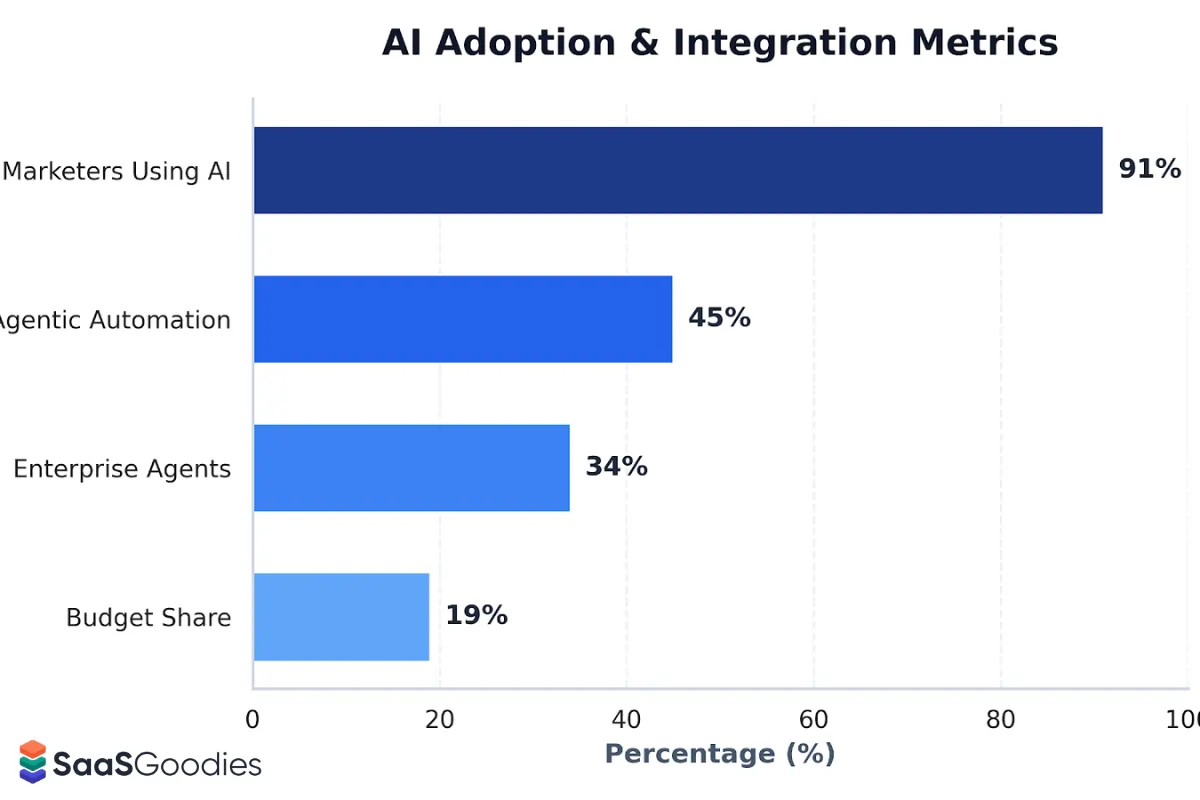
Adoption is close to universal. About 91% of marketers actively use AI this year. AI now takes up roughly 19% of marketing budgets, and that line grows near 28% a year.
Agents are the real story. These are systems that plan, act and finish a task without a human at every step.
The payoff shows in the numbers. Teams running agentic AI campaign automation report about 27% faster build times and 19% lower cost per qualified lead. Marketing automation as a whole returns about $5.44 for every dollar spent.
Search behaviour is changing under all of it. Around 73% of marketers now optimise content for AI-generated answers. Five of the six top marketer priorities this year are AI-driven.
AI Adoption in Performance Marketing for 2026
| Data Point | 2026 Figure | Change |
|---|---|---|
| Marketers using AI | 91% | Near universal |
| AI share of marketing budget | 19% | Growing 28% a year |
| Enterprise teams running agents | 34% | Up from 14% |
| Teams using agentic automation | 45% | Up from 15% in 2024 |
| Faster campaign builds with agents | 27% | Time saved |
| Lower cost per qualified lead | 19% | Efficiency gain |
| Marketing automation ROI | $5.44 per $1 | Top teams hit $8.71 |
A word of caution from our own testing. Obvious AI-generated ad creative underperforms. Major platforms quietly down-rank it. The winning setup pairs AI speed with a human editing pass. Pure machine output loses to hybrid work almost every time.
SaasGoodies take: Adoption is not the edge anymore. Everyone has the tools. The edge is measurement. Fewer than a fifth of teams can prove return from their AI spend. Set up clean tracking before you set up ten agents. We learned that the expensive way.
The Big Pivot: From Chasing New to Keeping Old
This one caught our eye. Buyer goals flipped in 2026. New customer acquisition is still the top objective at 54%, but that fell 10 points from last year.
Meanwhile, repeat purchases jumped as a priority. About 25% of buyers now name retention as a core spend goal, nearly double the 13% who said so in 2024.
Why the change? Simple maths. Acquisition costs keep climbing, so squeezing more from existing customers pays better. The industry is rebalancing toward keeping people, not just catching them.
This flows straight into channel choice. Retail media and CTV win partly because they measure real outcomes. Marketers now prize transaction proof over reach. Awareness alone is a hard sell to finance in 2026.
What Buyers Prioritise in 2026
Share of ad buyers naming each as a 2026 priority.
Ad Fraud: The Tax Nobody Voted For
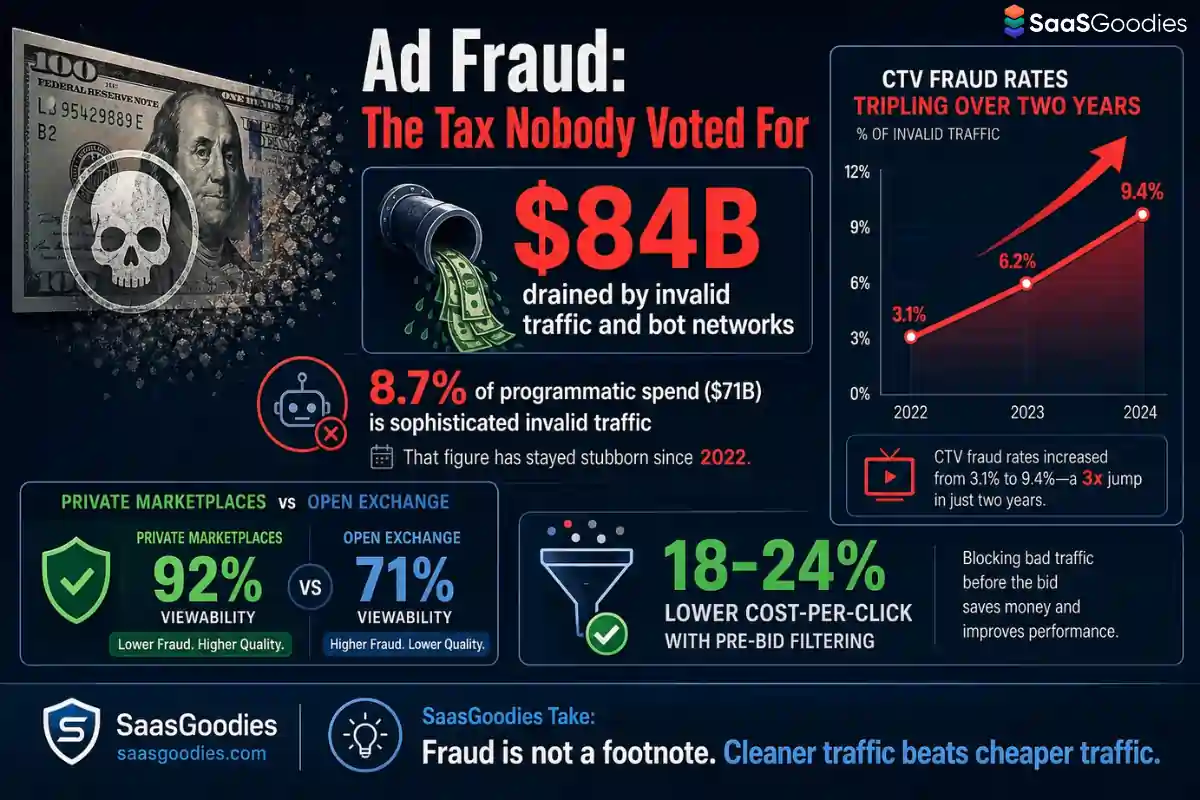
Not every dollar reaches a real person. Ad fraud remains the ugly cost of doing business.
Invalid traffic and bot networks drained an estimated $84 billion this year. Inside programmatic, sophisticated invalid traffic makes up about 8.7% of spend, roughly $71 billion. That figure has stayed stubborn since 2023.
Fraud follows the money. As retail media and CTV grow, bad actors chase them. CTV fraud rates tripled in two years as budgets moved there.
Quality control pays back fast. Private marketplaces show about 92% viewability against 71% on the open exchange, and far less fraud. Teams running pre-bid filtering report 18% to 24% lower cost per click with equal or better results.
SaasGoodies take: Fraud is not a footnote. If a tenth of your programmatic budget hits bots, your real cost per acquisition is worse than your dashboard claims. We run curated inventory and pre-bid filters as standard now. Cleaner traffic beats cheaper traffic.
How Smart Teams Are Moving Their Budgets in 2026
Knowing the numbers is one thing. Acting on them is another. The best teams are not rebuilding their whole media plan this year. They are moving money quietly, from slow channels to fast ones.
A simple split guides most of them. Roughly 70% goes to proven channels, 20% to growth bets, and 10% to pure experiments. That mix keeps the lights on while still chasing the next edge.
The reallocation logic is blunt. Find the budget sitting in channels growing below 5%. Move some of it to channels growing at 13% to 20%. Search and display stay useful, but they are not where the momentum lives.
Skills are shifting with the money. Demand is rising fast for creator partnership strategy, CTV media buying and answer-engine visibility. Around 94% of marketing leaders plan to raise spend on AI search visibility this year. Enterprises already put about 12% of digital budgets toward getting surfaced in AI answers.
Short video keeps pulling weight too. It commands roughly half of programmatic video spend, and social video makes up more than 53% of that. If your creative is not built for a vertical feed first, you are paying more for less reach.
SaasGoodies take: We run the 70-20-10 split across our own accounts, and it saves us from two classic mistakes. It stops us betting the farm on a shiny channel. It also stops us clinging to a tired one out of habit. Boring discipline wins more often than bold guesses.
Performance Marketing Benchmarks for SaaS Brands in 2026
Since this is our home turf, here is the SaaS cut. Software brands face a harder acquisition maths than most, so the benchmarks look different.
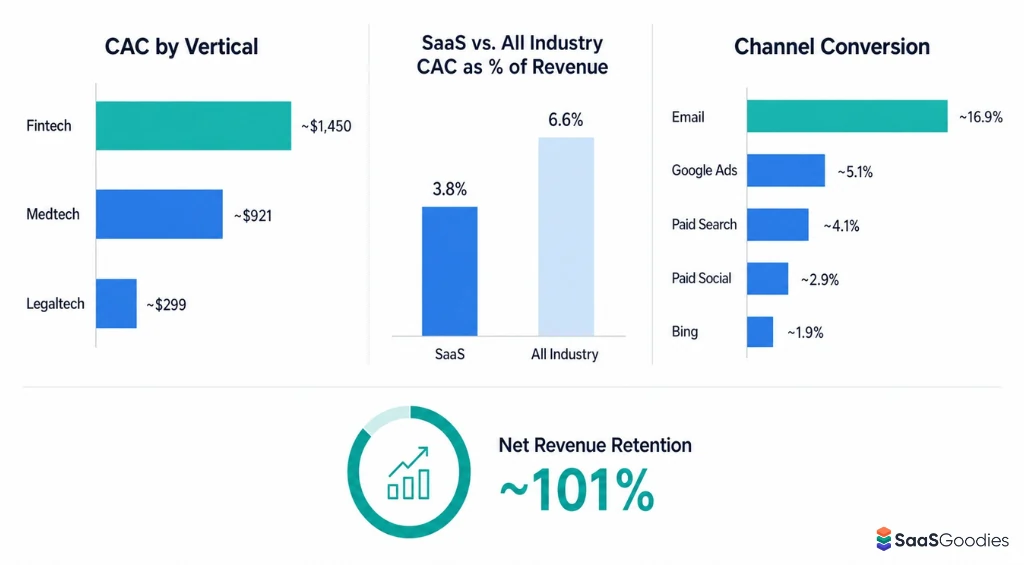
Customer acquisition cost swings hugely by vertical. Fintech carries the heaviest load near $1,450 per customer. Medtech follows around $921. Lighter categories like legaltech sit closer to $299. The median SaaS customer now costs about $2.00 to win each $1.00 of new recurring revenue, up 14% from 2023.
Conversion tells its own story. The median SaaS landing page converts at about 3.8%, below the 6.6% all-industry mark. Longer decision cycles and demo-led funnels squeeze the top of the funnel.
Channel choice matters more here than almost anywhere.
Retention is the quiet SaaS superpower. Median net revenue retention sits near 101%, and expansion revenue makes up a big slice of new income. A single well-placed article or nurture flow can pay recurring dividends for months.
SaaS Performance Benchmarks Snapshot for 2026
| Benchmark | 2026 Figure | Why It Matters |
|---|---|---|
| Fintech CAC | About $1,450 | Highest among SaaS verticals |
| Legaltech CAC | About $299 | Among the lowest |
| Median SaaS landing page CVR | 3.8% | Below the 6.6% all-industry mark |
| SaaS email conversion | 16.9% | Best-performing SaaS channel |
| Paid search vs paid social CVR | 4.1% vs 2.9% | Search wins on intent |
| Median net revenue retention | About 101% | Expansion beats churn |
The takeaway for software teams is clear. Guard your lifetime value to CAC ratio above 3:1, lean on email and organic, and keep payback under 12 months. Paid alone rarely pencils out in SaaS. It works best as one leg of a wider stool.
SaasGoodies take: We build and test SaaS tools ourselves, so we feel this daily. The cheapest customer is the one who never leaves. Onboarding fixes and a solid email flow move recurring revenue faster than a bigger cold ad budget. Spend on keeping, then on catching.
What We Expect for the Rest of 2026
Here is where we stick our neck out. Based on our accounts and this year's data, these are our calls for the months ahead.
None of this is a wild guess. It is the direction every honest metric points toward. The brands that act early on retention, clean measurement and AI-run buying pull ahead. The ones defending old habits fall behind.
Why Measurement Became the Real Battleground
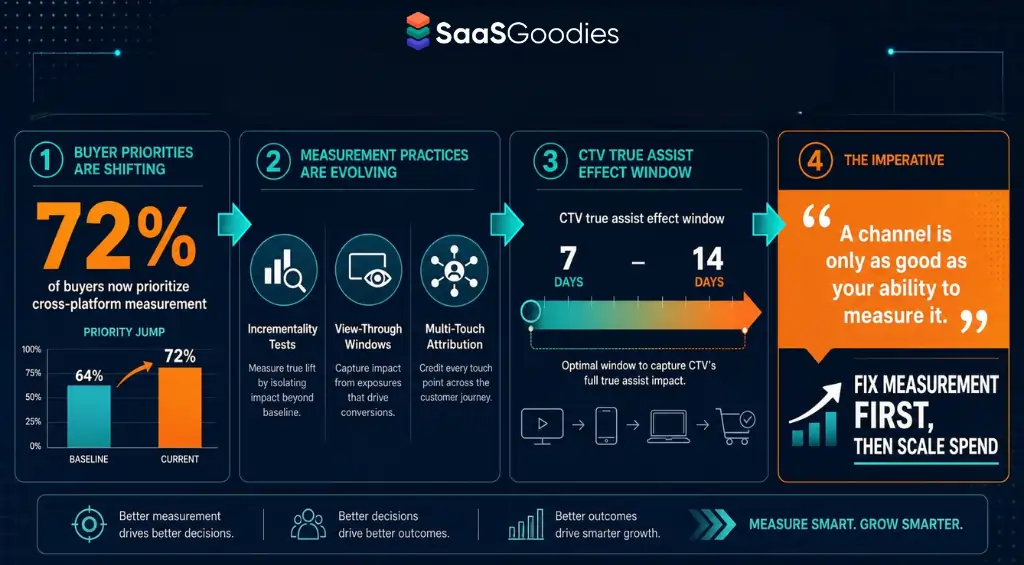
Here is the thread running through every stat above. The channels winning in 2026 all share one trait. They can prove what they did.
Cross-platform measurement jumped up the priority list this year, cited by about 72% of buyers, up from 64% last year. Marketers want to connect AI-run buying to outcomes they can defend in a boardroom.
Old habits are breaking down. Last-click attribution flatters some channels and starves others. Teams now lean on incrementality tests and view-through windows to see true impact. CTV, for one, needs a 7 to 14 day window to show its real assist effect.
The lesson is plain. A channel is only as good as your ability to measure it. Two brands can run the same CTV buy and reach opposite conclusions, purely because one measured it right. Fix measurement first, then scale spend.
Performance Marketing Statistics 2026: Fast Answers
How big is performance marketing in 2026?
Global ad spend crossed one trillion dollars for the first time in 2026. Digital holds about 68.7% of that total. Global digital ad spend sits near $740 billion, up 11.4% year on year.
Which channel is growing fastest?
Retail media leads at about 14.1% growth. US retail media spend reached $69.33 billion, up 17.8%. Amazon holds roughly 79.7% of that market.
What does a click cost in 2026?
Average Google Search cost per click is $4.22. Average conversion rate is 7.04%, and average cost per acquisition is $53.52. Cost per click rose for 87% of industries during 2025.
How much has customer acquisition cost risen?
Average social advertising customer acquisition cost rose 17.3%, from $1,100 to $1,290. Cold Meta traffic costs about $1,960 per customer, while warm retargeting costs about $840.
How many marketers use AI in 2026?
About 91% of marketers actively use AI. Around 34% of enterprise teams run autonomous agents in production. Teams using agent workflows report 19% lower cost per qualified lead.
What is a good ROAS in 2026?
Paid search averages near 5.3x, with a median around 3.5x. Judge it against your margin. A 4x return is strong for high-margin services but near break-even for thin-margin products.
The Bottom Line on Performance Marketing in 2026
Let us tie it together. The market is bigger than ever, but the rules changed. These Performance Marketing Statistics all point the same way. Money chases proof. Retail media, CTV and AI-run buying win because they measure real outcomes.
Costs keep rising, so retention now beats replacement. Your best growth lever in 2026 is often the customer you already have. We have run this playbook across our own accounts, and the pattern holds every time.
Treat this like a business, not a slot machine. Track past the first sale, filter your traffic, and let AI handle the busywork while you handle the strategy. That is where the winners sit this year.
Sources
We verify every figure against primary and reputable industry data. Here are the sources behind this report.
- Dentsu Global Ad Spend Forecasts
- eMarketer / IAB US Ad Spend Outlook
- Adtelligent Retail Media Market Outlook
- IAB CTV Ad Spend Forecast
- Basis Programmatic Advertising Trends
- WordStream / WebFX PPC Benchmarks
- ROAS Benchmarks by Industry
- Customer Acquisition Cost Statistics
- Marketing AI Adoption Statistics
- Marketing Automation Statistics
- Marketing Budget Trends 2026 (IAB, Influencer Marketing Hub)
- CRO and Cart Abandonment Statistics
- Salesforce State of Marketing
- Statista Advertising and Media Data