SaaS CAC & LTV Statistics 2026: Unit Economics Benchmarks

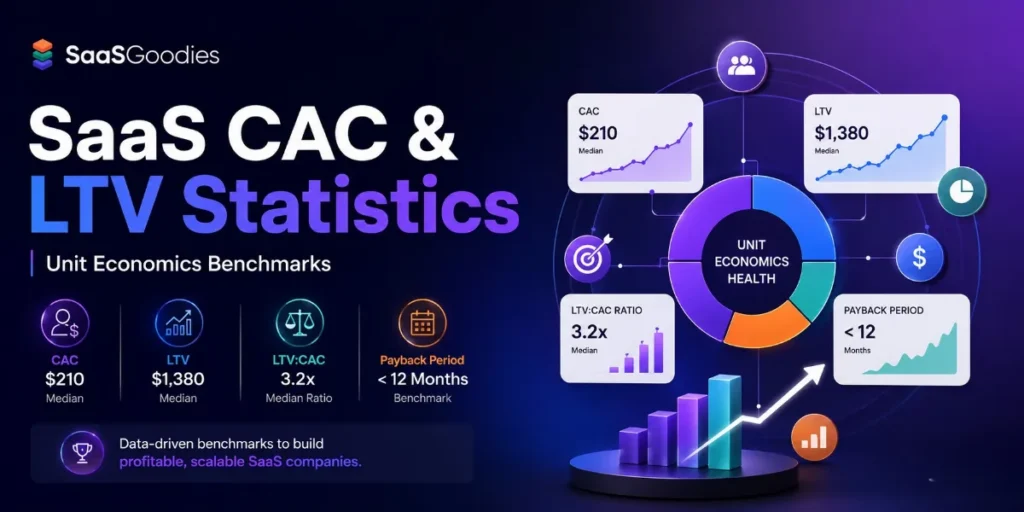
The growth-at-all-costs era is over — the median B2B SaaS company now runs an LTV:CAC ratio of 3.2:1 and spends $2.00 to acquire $1.00 of new ARR, up 14% in two years.
CAC (customer acquisition cost) is what it costs to win a customer; LTV (lifetime value) is what that customer is worth; the ratio between them is the single clearest test of whether a SaaS business works. In 2026 diligence, these shifted from nice-to-have to deal-breaker.
But the famous “3:1” benchmark hides a trap: LTV is fiendishly hard to calculate accurately, and CAC swings 5–10x by channel, so most companies measure both wrong.
Key SaaS CAC & LTV Statistics at a Glance
What's a Good LTV:CAC Ratio for SaaS?
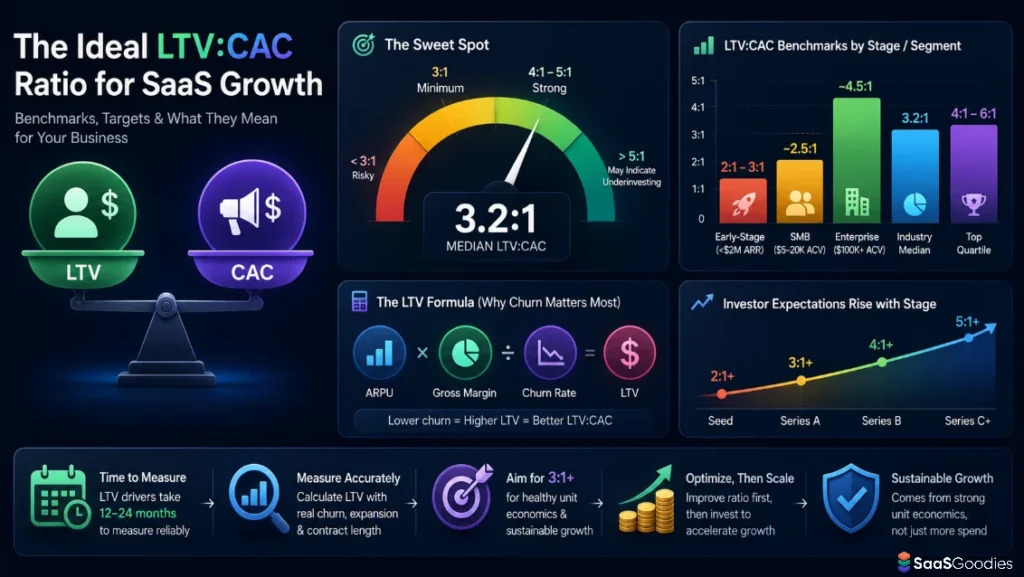
The median B2B SaaS LTV:CAC ratio is 3.2:1, with 3:1 the minimum for sustainable growth, 4:1–5:1 strong, and above 5:1 sometimes a sign of underinvesting in acquisition. Two independent datasets — 939 and 612 companies — both land on 3.2:1.
| Stage / segment | LTV:CAC target |
|---|---|
| Industry median | 3.2:1 |
| Top quartile | 4:1–6:1 |
| Enterprise ($100K+ ACV) | ~4.5:1 |
| SMB ($5–20K ACV) | ~2.5:1 |
| Early-stage (<$2M ARR) | 2:1–3:1 acceptable |
SaasGoodies Insight: 3:1 is the number everyone quotes, but it is, as one analysis put it, fiendishly difficult to calculate accurately — LTV depends on churn, expansion and contract length, all of which take 12–24 months to measure reliably. A company with six months of history projecting a five-year LTV is guessing.
How is CAC Calculated — and What's The Trap?
Average B2B SaaS CAC runs between $702 and $1,200 depending on the dataset, but the bigger problem is that most companies calculate it wrong by confusing cost-per-lead with true acquisition cost. The denominator decides everything.
What this means for operators: the CAC headline ($702 vs $1,200) matters less than the calculation discipline behind it. True CAC includes ad spend, agency fees, sales and SDR salaries, commissions, tools and events — not just the visible ad cost.
Most companies undercount, producing false confidence. For affiliates, this is the quiet reason SaaS programs pay generous commissions: a $1,200 blended CAC makes a referral fee look cheap by comparison.
How Does CAC Vary by Channel?
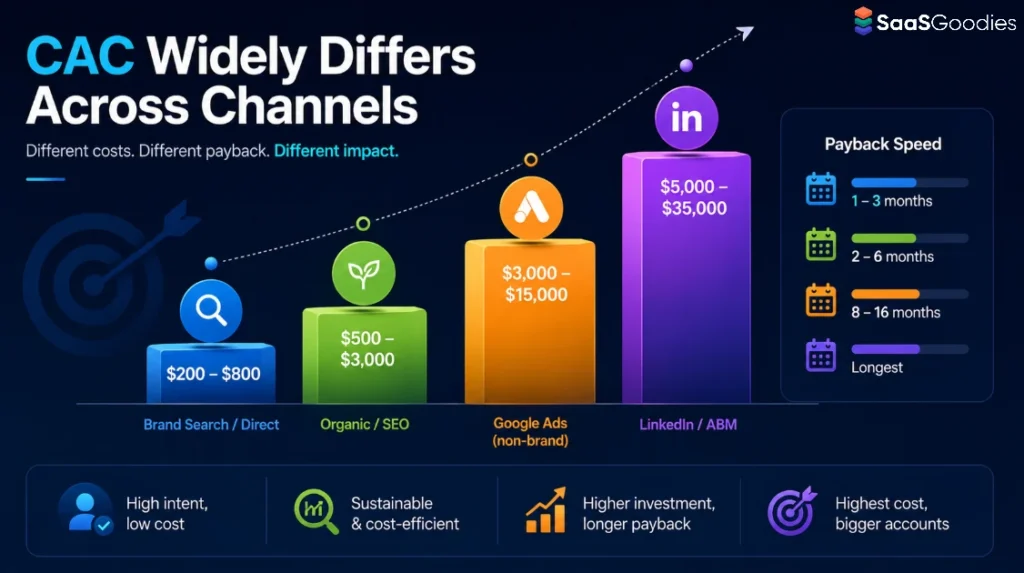
CAC swings more than 100x by channel — from $200 on brand search to $35,000 on ABM — which is why a single blended CAC number hides whether acquisition is efficient or wasteful. Channel mix, not a blended average, is the real lever.
| Channel | CAC range | Payback |
|---|---|---|
| Brand search / direct | $200–$800 | 1–3 months |
| Organic / SEO | $500–$3,000 | 2–6 months |
| Google Ads (non-brand) | $3,000–$15,000 | 8–16 months |
| LinkedIn / ABM | $5,000–$35,000 | longest |
SaasGoodies Take: a blended CAC is a vanity number — it mixes $200 brand-search customers with $35,000 ABM customers and tells nobody which channel works. The winners blend low-CAC channels (brand search, organic, referral) for volume with high-CAC channels (LinkedIn, ABM) for enterprise.
What's a Good CAC Payback Period?
The median SaaS CAC payback is 6.8 months, with B2B at 8.6 and B2C at 4.2 — and 76% of companies recover acquisition cost within the healthy 12-month window. Payback beats LTV:CAC because it's grounded in real cash, not projections.
| Segment / vertical | CAC payback |
|---|---|
| Median (all SaaS) | 6.8 months |
| B2B SaaS | 8.6 months |
| B2C apps | 4.2 months |
| Education vertical | 3.8 months |
| HR / Recruiting vertical | 10.6 months |
Key Insight: the generic “12–18 months” payback benchmark is useless without context — a seed-stage SMB tool and a Series C enterprise platform have completely different profiles.
The under-appreciated insight is that payback speed beats ratio size: a fast-paying 3:1 customer is better than a slow-paying 5:1 one, because cash recovered is cash that can be redeployed.
Why is LTV so Hard to Measure Accurately?
Most SaaS LTV figures are projections, not measured data — and because churn isn't constant, expansion is lumpy and cohort quality varies, a six-month-old company projecting a five-year LTV is essentially guessing. The number that anchors every pitch deck is the least reliable in the stack.
SaasGoodies Recommendation: Treat any LTV number — including a benchmark — as an estimate with a wide error bar. The disciplined move is to anchor on cohort-based actuals where possible and lean on CAC payback, which is measured in real recovered cash. A muddled or inflated LTV does more damage in diligence than a low-but-honest one.
What Sales-efficiency Metrics Define a Strong SaaS in 2026?
Beyond LTV:CAC, investors now scrutinise the Magic Number, burn multiple and Rule of 40 — and companies that exceed the Rule of 40 command revenue multiples roughly twice their less-efficient peers. Efficiency, not raw growth, wins term sheets.
| Metric | Healthy benchmark |
|---|---|
| Magic Number | >0.75 (median fell below 0.6) |
| Burn multiple | <2x (problem above 3x) |
| Rule of 40 | growth% + profit% ≥ 40 |
| Gross margin | 70–85% |
Key Takeaway: The metric set that wins funding in 2026 is retention quality, payback discipline and burn efficiency — not the up-and-to-the-right growth chart that worked in 2021.
For founders, the practical advice is to pick a focused set of these metrics, calculate them honestly, and tell a clean story about each. An inflated metric does more damage than a low, honest one.
How Long is The SaaS Sales Cycle, and How Does NRR Change the Maths?
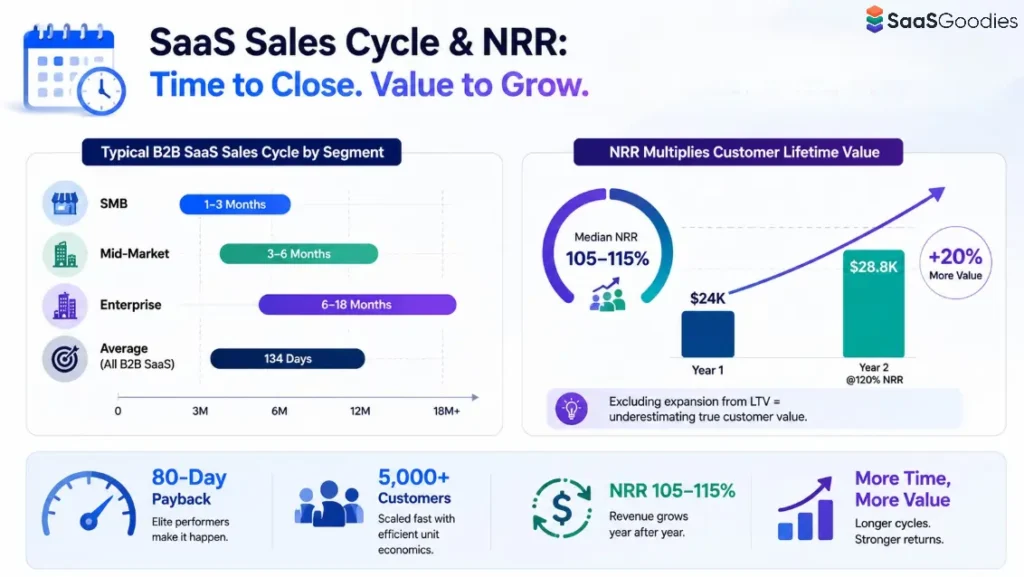
The average B2B SaaS sales cycle is 134 days, stretching from 1–3 months for SMB to 6–18 months for enterprise — and because net revenue retention runs 105–115%, leaving expansion out of LTV badly understates a customer's true worth. Time-to-close and expansion both reshape the economics.
| Segment | Sales cycle |
|---|---|
| SMB | 1–3 months |
| Mid-market | 3–6 months |
| Enterprise | 6–18 months |
| Average (all B2B SaaS) | 134 days |
What this means for operators: sales cycle length is the hidden driver of CAC — a 134-day average means months of SDR and AE time loaded into every acquisition, which is why enterprise CAC runs into the thousands.
The NRR point is the optimistic counterweight: a customer base expanding at 110%+ keeps growing LTV without a single new sale, which is why retention and expansion now anchor the whole unit-economics story.
What These SaaS CAC & LTV Statistics Mean for 2026
| Efficiency metric | Healthy benchmark |
|---|---|
| LTV:CAC | ≥3:1 (median 3.2:1) |
| CAC payback | <12 months (median 6.8) |
| Gross margin | 70–85% |
| Burn multiple | <2x (danger >3x) |
- Optifai — “B2B SaaS LTV Benchmarks” (939 companies).
- GrowthSpree — “B2B SaaS LTV:CAC Ratio Guide 2026” & “CAC Payback Benchmarks 2026” (Bessemer, SaaS Capital data).
- Proven SaaS — “CAC Payback Benchmarks 2026” (14,500+ companies).
- knowledgelib — “CAC & LTV Benchmarks for B2B SaaS” (612 companies).
- SaaSHero — “B2B SaaS LTV:CAC Benchmarks 2026.”
- Beancount — “The 2026 SaaS Metrics Stack: LTV, CAC, NRR, Rule of 40.”
- Eagle Rock CFO — “SaaS Benchmarks by Stage (2026).”
- Bessemer Venture Partners — “2026 State of the Cloud” (via GrowthSpree).