SaaS Churn Rate Statistics 2026: The Real Retention Gap

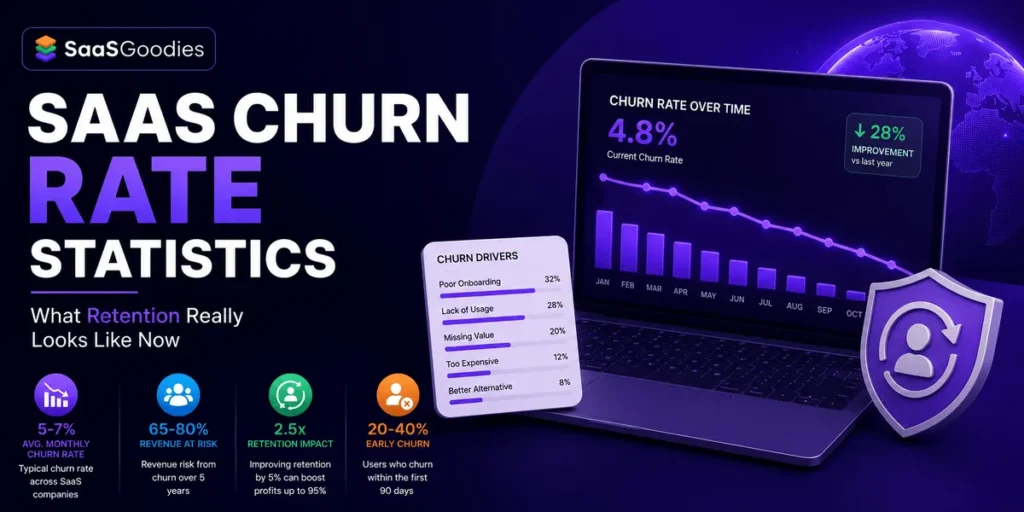
Quick answer up front: The average B2B SaaS company still loses about 3.5% of customers every month in 2026. That compounds to roughly 31% a year if nobody lifts a finger. Ouch.
But one headline hides everything. Enterprise tools churn under 2% a year. SMB tools bleed 30% to 58%. AI-native apps? Some sit below 40% gross revenue retention.
We pulled the freshest SaaS Churn Rate Statistics for 2026, sense-checked every figure, and added our own calls. No fluff. No recycled 2022 numbers. Just what churn looks like right now, and where it bites hardest.
The Headline Churn Benchmarks Every Operator Should Know
Let's start wide, then zoom in. Churn is not one number. Report it wrong and you either panic over nothing or ignore a slow leak that sinks you.
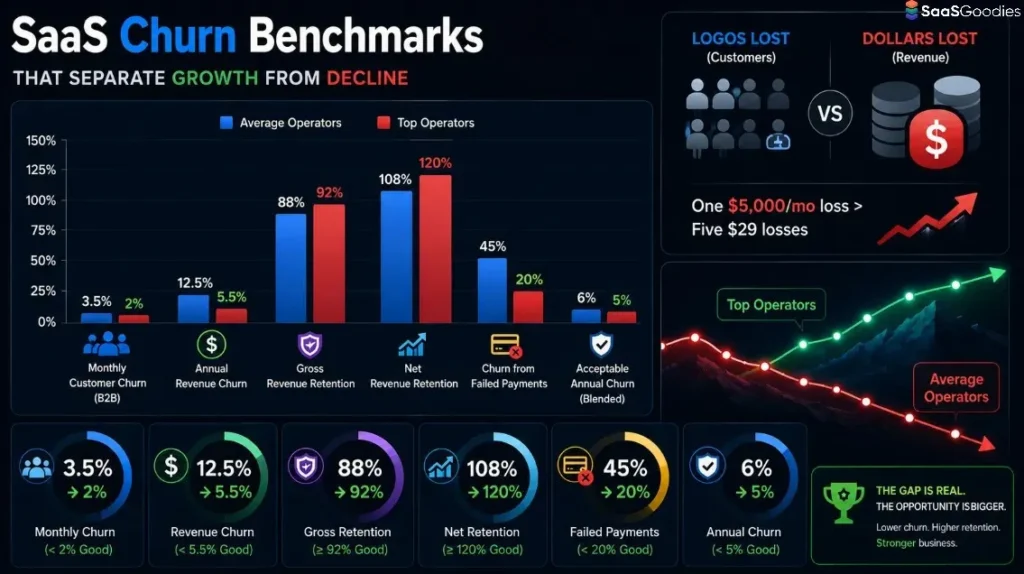
Two families of churn exist. Customer churn counts logos lost. Revenue churn counts dollars lost. Losing one $5,000-a-month account hurts more than losing five $29 accounts. So track both, always.
Here are the top-line 2026 markers we anchor to.
| Metric | 2026 Benchmark | What “Good” Looks Like |
|---|---|---|
| Average monthly customer churn (B2B) | 3.5% (2.6% voluntary, 0.8% involuntary) | Under 2% monthly |
| Median annual revenue churn | 12.5% (up from 11.34% a year earlier) | Below 5.5% (top quartile) |
| Median gross revenue retention | 88% | 92% or higher |
| Median net revenue retention | 106% to 110% | 120% or higher |
| Share of churn from failed payments | 40% to 48% | Under 20% |
| Acceptable annual churn (blended) | 5% to 7% | Sub-5% |
Notice the gap between the median and the good column. That gap is where valuation multiples live. A company at 130% net revenue retention trades far richer than a leaky one at 90%.
SaasGoodies take: We've reviewed enough subscription tools to spot the pattern instantly. Founders quote monthly churn to sound healthy, then hide annual revenue churn because it stings. Ask for both. If someone only shows you one, assume the other one is ugly.
Monthly vs Annual Churn: The Maths That Fools People
Here's a trap we see weekly. People multiply monthly churn by 12. Wrong move.
Churn compounds. Use this instead: annual churn = 1 minus (1 minus monthly rate) to the power of 12. A 3% monthly rate lands near 31% a year, not 36%.
Small monthly gaps turn into brutal annual gaps. Watch what happens to a business at $100,000 monthly recurring revenue with zero new sales.
| Monthly Churn | Annual Churn (Compounded) | MRR After 12 Months | Average Customer Lifetime |
|---|---|---|---|
| 2% | 21.5% | $78,500 | 50 months |
| 3% | 30.6% | $69,384 | 33 months |
| 5% | 46.0% | $54,036 | 20 months |
| 8% | 63.2% | $36,770 | 12.5 months |
Drop from 5% to 3% monthly and you keep an extra $15,000 of starting revenue. Same product. Same team. Just less leaking.
The average customer lifetime value swings just as hard. At 2% monthly, a customer sticks around 50 months. At 5%, barely 20. You have less than half the time to earn back what you paid to win them.
Churn by Company Size and ARR Stage
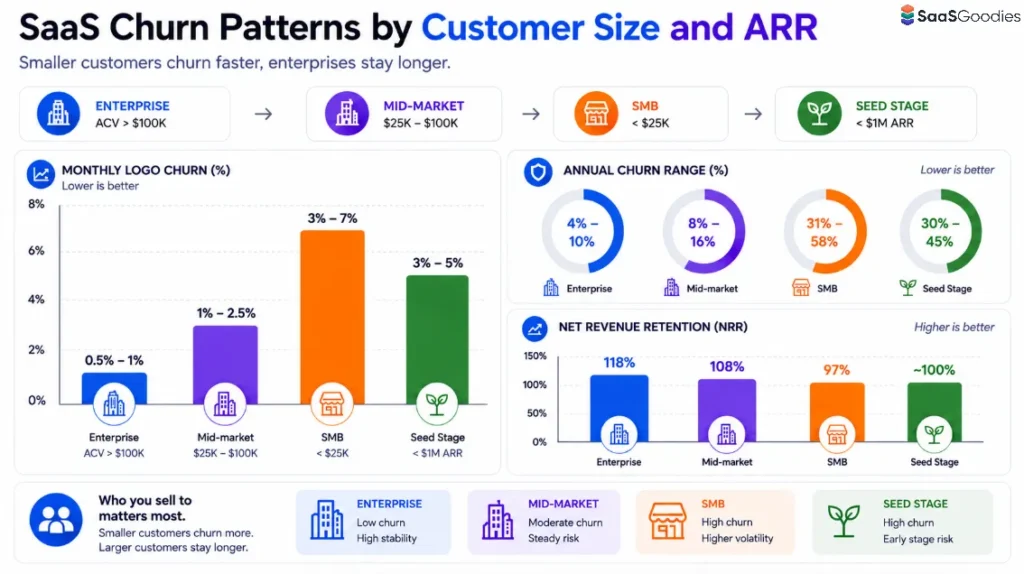
Who you sell to decides your churn more than anything else. A rate that spells disaster for one company is perfectly fine for another.
Small business customers cancel fast. They fail, switch, or cut costs. Enterprise customers move slowly, sign long deals, and rarely rip out a tool mid-contract.
| Segment | Typical Monthly Logo Churn | Annual Churn Range | Median NRR |
|---|---|---|---|
| Enterprise (ACV above $100K) | 0.5% to 1% | 4% to 10% | 118% |
| Mid-market ($25K to $100K ACV) | 1% to 2.5% | 8% to 16% | 108% |
| SMB (below $25K ACV) | 3% to 7% | 31% to 58% | 97% |
| Seed stage (under $1M ARR) | 3% to 5% | 30% to 45% | Around 100% (wide) |
See that SMB net revenue retention of 97%? Founders panic at it. They shouldn't. For a self-serve product selling below $25K a year, that number sits right on benchmark. Holding 100% at SMB scale is genuinely strong.
Scale changes the picture too. Companies above $10M in revenue average around 8.5% churn. Smaller firms often run past 20%. Bigger companies simply have better onboarding, deeper integrations, and dedicated success teams.
SaasGoodies take: Stop comparing yourself to “SaaS average”. It's a fantasy number that blends a seed-stage SMB app with Salesforce. We tell every operator we work with the same thing. Benchmark against your own ACV band and go-to-market motion. Nothing else.
Churn by Industry: Who Leaks the Most in 2026
Your vertical sets a floor. Regulated categories lock customers in. Low-switching-cost categories watch them walk.
Cybersecurity and healthcare sit stickiest. Compliance, data migration pain, and staff retraining make switching a year-long project. Marketing tech sits leakiest. Budgets get re-checked yearly and rivals are one click away.
This is the vertical map we keep pinned. Figures show median gross annual churn.
| SaaS Vertical | Median Gross Annual Churn | Monthly Churn Signal | Why It Behaves This Way |
|---|---|---|---|
| Cybersecurity | 7% | Low | Compliance lock-in, mission critical |
| Healthcare / Health IT | 8% | Low headline, hidden risk | Hard migrations, but rose 67% in 2025 |
| Vertical / niche SaaS | 9% | Moderate | Workflow-embedded, few rivals |
| Fintech / Financial SaaS | 11% | Moderate | Security demands, high trust barrier |
| Developer tools | 14% | Moderate, strong expansion | Small accounts leave, big ones grow |
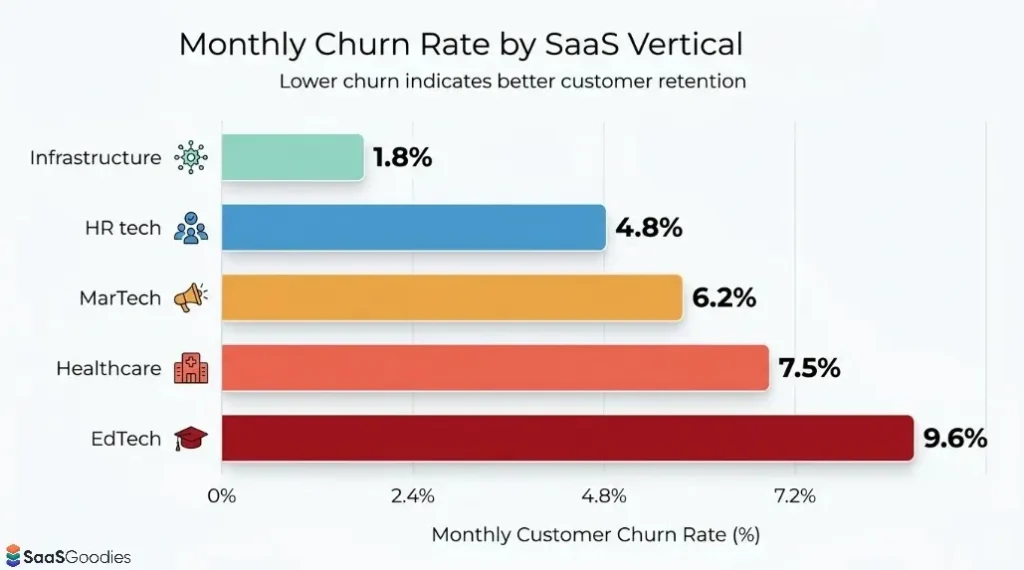
| HR tech / back office | 15% | 4.8% monthly | Payroll integration slows switching |
| MarTech / AdTech | 21% | 6.2% monthly | Yearly budget re-checks, easy swaps |
| Education tech | 22%+ | 9.6% monthly (highest) | Seasonal budgets, doubled in 2025 |
Look at the range. Education tech churns roughly three times harder than cybersecurity. And EdTech customer churn doubled from 11% to 22% across 2025. School budgets and seasonal spending are the culprits.
Here's the same picture as a chart. Easier to feel the spread.
SaasGoodies take: Low churn in healthcare fools people. That 0.8% monthly headline in health IT looks amazing. It isn't the full story. Regulated customers stay unhappy for a year before they leave, and once gone, you almost never win them back. A calm churn number can still hide a rotting base.
Voluntary vs Involuntary Churn: The Leak You Can Actually Plug
Here's the stat that surprises most founders. Up to 40% to 48% of all churn is involuntary. Nobody chose to leave. A card expired. A payment bounced. The subscription just lapsed.
Expired credit cards alone cause around 42% of failed payments. That's not a product problem. That's a billing plumbing problem, and it's the cheapest churn you will ever fix.
Good failed payment recovery changes the game. Smart dunning, automated retries, and card-updater services recover 50% to 80% of failed payments with zero product changes. AI-driven recovery now runs 2 to 4 times better than plain retry logic.
Across the industry, recoverable revenue from payment failures runs into the billions each year. A chunk of that sits in accounts that never meant to leave at all.
Net Revenue Retention: The Number Investors Watch First
Logo churn tells you who left. It won't tell you if you're growing. That job belongs to net revenue retention.
Net revenue retention takes your starting revenue, adds expansion, then subtracts downgrades and churn. Above 100% means your existing base grows on its own, even with zero new logos. That's the flywheel every founder wants.
Gross revenue retention is the floor metric. It strips out expansion and shows pure survival. It caps at 100%. A healthy gap between the two sits around 15 to 25 points.
| ARR Stage | Median NRR | Median GRR | Best-in-Class NRR |
|---|---|---|---|
| Early stage ($0 to $5M) | 104% | 82% | 115% |
| Growth stage ($5M to $25M) | 110% | 86% | 125% |
| Scale stage ($25M to $100M) | 115% | 89% | 130% |
| Mature ($100M+) | 118% | 91% | 135%+ |
Bootstrapped companies between $3M and $20M ARR post a median net revenue retention near 103% in 2026. Top performers reach almost 118%. Median gross retention for that same group sits around 91%.
Here's the same NRR ladder as a chart.
Median Net Revenue Retention by ARR Stage (2026)
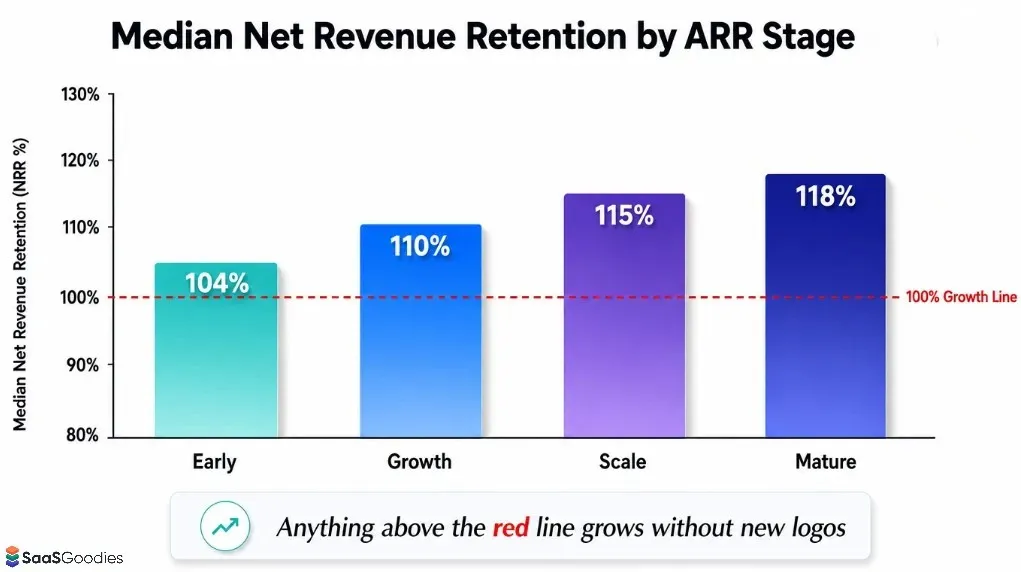
Why does everyone obsess over this? Because it compounds. Two companies start at $10M ARR. One holds 120% net revenue retention, one sits at 95%. Three years later they're $15M apart, from retention alone.
One lever stands out. Usage-based pricing models routinely post 115% to 130% NRR. Flat per-seat models sit closer to 95% to 105%. When revenue grows as customers use more, expansion happens without a single sales call.
SaasGoodies take: If you promote SaaS tools as an affiliate, net revenue retention should shape your picks. High-NRR products keep customers longer, which keeps recurring commissions alive longer. We favour tools with sticky expansion motions over flashy front-end offers that churn in three months.
How Churn Quietly Wrecks Your Valuation
Retention stopped being a health metric. In 2026 it's a price tag. Buyers and investors read your churn before they read your growth story.
Look at public companies first. Those above 120% net revenue retention trade around 9.3 times revenue. Those below 100% trade closer to 3.1 times. Same category, triple the multiple.
The maths gets personal fast. A 10-point lift in net revenue retention adds roughly 20% to 30% to valuation. On an $8M ARR business, that's the difference between a decent exit and a life-changing one.
Logo churn moves the needle too. For a company between $3M and $20M ARR, the gap between 3% and 8% annual logo churn maps to a 2 to 3 times swing in valuation multiple. Same revenue. Wildly different price.
Private SaaS in the lower middle market trades between 3 and 7 times ARR, with a median near 4.5 times. Score above 50 on the Rule of 40, hold net revenue retention past 120%, and 7 times or higher becomes realistic.
Here's the cleanest single takeaway we can give you. Crossing from 105% to 110% net revenue retention often adds 0.5 to 1 times ARR to a buyer's offer. On a $7M ARR business, one metric shift can mean millions in exit value.
SaasGoodies take: This is why we roll our eyes at “growth at all costs”. A leaky bucket growing at 40% still sells for less than a tight one growing at 25%. Retention is the number that pays you twice: once in kept revenue, again in a fatter multiple when you sell.
AI-Native SaaS: The Retention Story of 2026
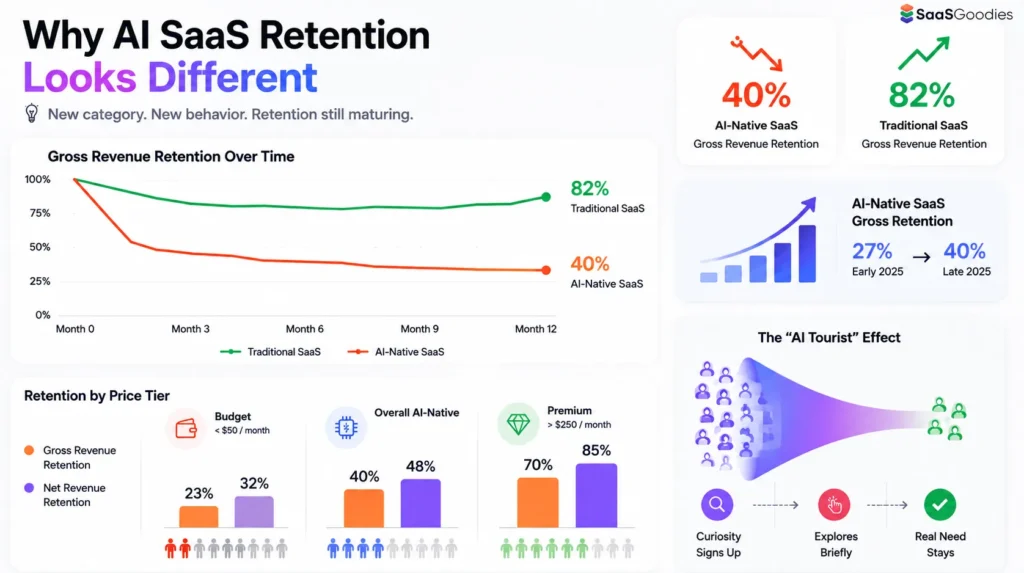
New category, new problem. AI-native tools show a churn pattern nobody had benchmarks for two years ago.
Overall, AI-native SaaS posts around 40% gross revenue retention. Compare that to the 82% median for traditional B2B SaaS. The gap is enormous.
Price point acts as the filter. Look at the split.
| AI Tool Price Tier | Gross Revenue Retention | Net Revenue Retention | Read |
|---|---|---|---|
| Budget (under $50/month) | 23% | 32% | Heavy “AI tourist” leakage |
| Overall AI-native | 40% | 48% | Stabilising, still fragile |
| Premium (above $250/month) | 70% | 85% | Matches solid B2B SaaS |
The “AI tourist” effect explains the budget tier. People sign up out of curiosity, poke around, then vanish. Real workflow need never formed.
There's good news though. Gross retention for AI-native tools climbed from 27% in early 2025 to 40% by late 2025. As the tourists churn out, the committed base firms up. We read that as a category settling down, not falling apart.
Why SaaS Customers Actually Cancel
Numbers tell you how many left. Reasons tell you how to stop it. Post-cancellation data across 2025 and 2026 points to a clear split.
Add fit gap and value gap together. That's 40% of churn, and both get fixed upstream, before the customer ever signs. Sharper targeting and faster onboarding beat any last-minute save. This is the part most teams skip, and it costs them dearly.
Timing matters just as much. Roughly 60% to 70% of churn happens inside the first 90 days. Get a user to their “aha moment” within 7 days and churn drops by about half.
Want early warning? These signals fire before a cancellation, ranked by lead time.
Contract Length and Pricing: The Cheapest Churn Fix Going
Want lower churn without touching your product? Change how people pay.
Annual subscribers churn at roughly one-third the rate of monthly ones. Move a default plan from monthly to annual, add a 15% to 20% discount, and churn often falls 40% to 60%. No new features required.
By 2026, around 40% of SaaS companies between $15M and $30M ARR reached negative churn. Their expansion revenue now outgrows their losses. Most got there through usage-based and per-seat pricing that grows with the customer, not through slashing prices.
Billing cadence is the most under-used churn lever we see. It costs nothing to test. Move your default to annual, add a fair discount, and watch retention climb over the next two renewal cycles.
The Real Cost of a Leaky Bucket
Churn is not a customer-success problem. It's a money problem. Every point you lose shows up twice: once as lost revenue, once as the cost to replace it.
Start with acquisition. Winning a fresh customer costs 5 to 7 times more than keeping an existing one. So every avoidable cancellation forces you to spend again just to stand still.
Now the upside. A 5% lift in customer retention can raise profit by anywhere from 25% to 95%. Very few growth levers come close to that return on effort.
Then there's the silent drain. Failed payments quietly bleed recurring revenue every month. Industry-wide, recoverable revenue from payment failures runs into the billions each year. Most of it sits in accounts that never chose to leave in the first place.
Put it plainly. With more than 30,000 SaaS companies competing globally, acquisition keeps getting pricier. Retention is the cheapest growth channel you own. It just doesn't feel as exciting as a shiny new logo.
SaasGoodies take: We learned this running our own recurring offers. A saved customer beats a new one on almost every measure: cheaper, faster, and worth more over time. When we score affiliate programs, retention quality quietly counts more than the headline payout.
Retention Benchmark Targets Worth Stealing
Enough theory. Here are the 2026 numbers we'd actually hold a SaaS product to. Pin these somewhere visible.
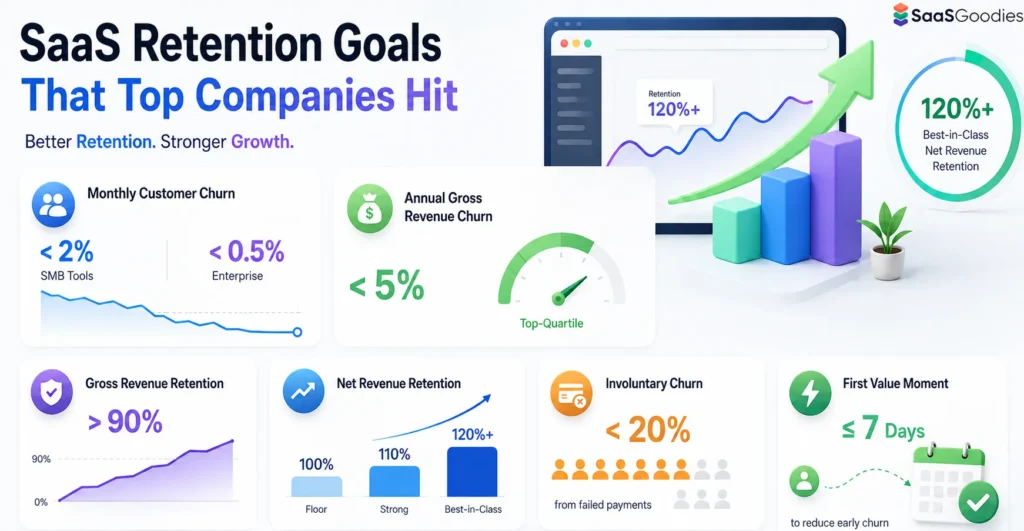
None of these are stretch goals for a well-run product. They're the baseline for 2026. Miss them badly and you'll feel it at renewal, at fundraise, and at exit.
SaaS Churn Rate Statistics 2026: Our Projections and Calls
Time for our own read. We track these churn numbers across dozens of tools we review and promote, so here's where we think 2026 lands. Treat them as our estimates, not gospel.
One prediction we hold loosely but strongly. Churn prediction moves from dashboards to automated action. Tools won't just flag an at-risk account.
They'll trigger the save play on their own. That shift alone could shave a point or two off monthly churn for teams who adopt it early.
SaasGoodies take: After years of testing subscription tools and running our own recurring offers, our lesson is simple. Churn is rarely a single dramatic event. It's a hundred small neglects. Slow onboarding, a bounced card, a quiet drop in logins. Fix the boring stuff first. It pays better than any growth hack.
SaaS Churn Rate Statistics: Frequently Asked Questions
What is a good SaaS churn rate in 2026?
A good monthly churn rate is under 2% for SMB-focused tools and under 0.5% for enterprise ones. Blended B2B sits at 3.5% monthly, so consistently beating that is a healthy sign. Annual gross churn under 5% counts as top-quartile work.
What is the average SaaS churn rate right now?
The average B2B SaaS company loses about 3.5% of customers each month in 2026. That splits into 2.6% voluntary and 0.8% involuntary. Median annual revenue churn sits near 12.5%.
Why is net revenue retention more important than churn?
Logo churn only counts who left. Net revenue retention shows if your existing base grows on its own. A company above 100% NRR can grow revenue even with zero new customers, which is why investors weigh it first.
How much churn is involuntary?
Between 40% and 48% of churn comes from failed payments, not real cancellations. Expired cards drive about 42% of those failures. Smart dunning recovers 50% to 80% of that revenue, making it the easiest churn to fix.
Do annual contracts really reduce churn?
Yes, and by a lot. Annual plans churn at roughly one-third the rate of monthly plans. Shifting defaults to annual billing with a modest discount often cuts churn by 40% to 60% without any product change.
Why do AI-native SaaS tools churn so much?
Budget AI tools under $50 a month retain only 23% of gross revenue. Curious users sign up, test, and leave. Premium AI tools above $250 a month hold 70% gross retention, matching solid traditional SaaS.
The Bottom Line on SaaS Churn in 2026
Churn in 2026 is not one scary number. It's a set of numbers that only make sense next to your segment, your vertical, and your pricing. A 15% annual rate can be a crisis or a win. Context decides.
Fix the cheap leaks first. Plug failed payments. Push annual billing. Nail the first 90 days. Then chase expansion through pricing that grows with your customer. Do that, and retention stops being a worry and starts being your edge.
- Recurly Churn Report and Benchmarks
- ChartMogul SaaS Retention Reports
- SaaS Capital Bootstrapped Benchmarks
- Lighter Capital B2B SaaS Startup Benchmarks
- Bessemer Venture Partners State of the Cloud
- OpenView SaaS Benchmarks
- Paddle and ProfitWell Subscription Data
- Statista Software and SaaS Market Data
- Gartner SaaS and Cloud Research
- Bain and Company Retention Economics