SaaS Free Trial Statistics 2026: Card vs No-Card Data

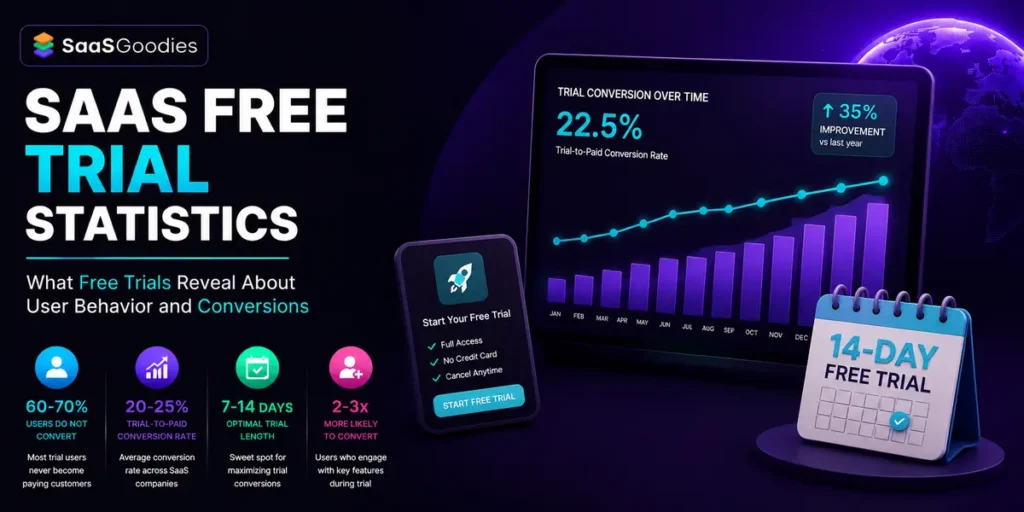
Here's the number that stops most founders cold. The median free trial converts to paid at just 8% in 2026. That average is almost useless on its own. Your trial model moves the result more than anything else you touch.
Credit-card trials convert near 30%. No-card trials sit around 6%. Freemium limps below 5%. We've run and audited enough trials to say it plainly: model choice is most of the game.
These SaaS free trial statistics cut past the vanity averages and show what good actually looks like, sorted by model, length, industry, and stage, with our own calls stitched in.
The free trial numbers every SaaS founder should memorise
Let's set the table before we argue about tactics. A free trial is not one metric. It is a chain of them.
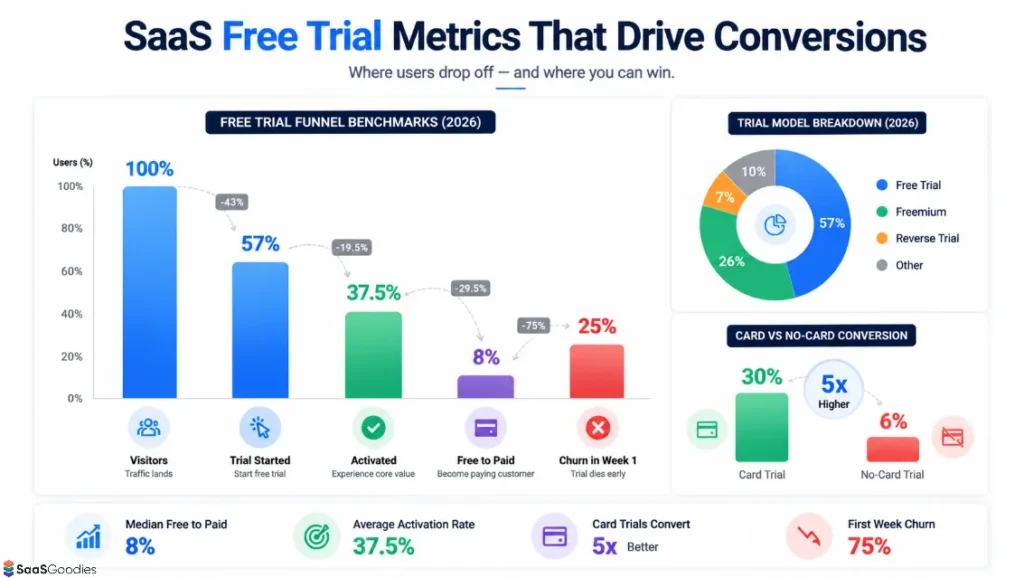
Traffic lands. Some visitors start a trial. Some trial users activate. A slice of those pay. Each step leaks, and the leaks compound.
Here are the headline figures we lean on this year. Keep them handy, because most benchmark posts quote one number and skip the context that makes it mean something.
| Free trial metric (2026) | Figure | Quick read |
|---|---|---|
| Median free-to-paid conversion | 8% | True middle, but the spread is huge |
| Products using free trial as primary motion | 57% | Still the default entry point |
| Products using freemium as primary motion | 26% | Half the free-trial rate |
| Products using a reverse trial | 7% | Small but the fastest riser |
| Free-trial products asking for a card upfront | 20% | Rare, and hugely underused |
| Card trials vs no-card trials conversion gap | 5x | Roughly 30% against 6% |
| Average SaaS activation rate | 37.5% | Nearly two-thirds never hit core value |
| Users who churn in their first week | 75% | The trial dies early or not at all |
Notice the pattern already. The averages hide two very different populations. Around 20% of free-trial products convert below 2.5%. About a quarter convert above 25%.
So when someone tells you the SaaS benchmark is 8%, ask which model, which industry, and which trial length. The answer changes everything.
Straight from the trials we run: we treat the 8% median as a warning label, not a target. Products that anchor to it end up optimising toward mediocrity. Pick your model first, then chase the ceiling that model allows.
Why free trial data carries more weight than ever in 2026
Ten years ago the free trial was a marketing tactic. Now it is the whole go-to-market motion for a big slice of software.
The context matters. The global SaaS market is on track to near $800 billion by 2029, and most of that growth runs through self-serve signups.
Money is flooding in, and so is competition. More budget chases the same in-market buyers, which means your trial has to work harder than the one you shipped two years ago.
Buyer patience shrank too. People now compare three tools in an afternoon and abandon any product that fails to prove itself fast. A slow trial is a lost trial.
AI changed the top of the funnel as well. Buyers open a chat assistant, get a shortlist, and start trials with intent already formed. One site reported assistant-sourced traffic converting at 24%, roughly six times its search traffic.
So these SaaS free trial statistics are not trivia. They are the operating manual for the channel that now decides if most software companies grow or stall.
Trial model decides your conversion before onboarding even starts
This is the single most important idea in the whole post. Your free trial conversion rate is set mostly by the model you pick, long before you touch a single onboarding email.
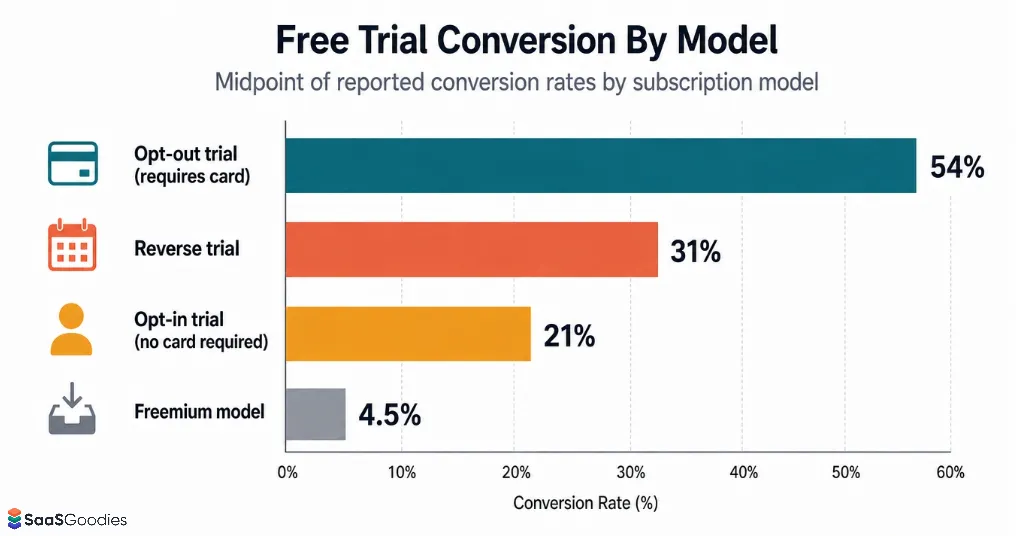
Four models dominate SaaS in 2026. They convert at wildly different rates.
The rate gap between these models is bigger than any button-colour test or onboarding tweak will ever give you. Across a large 2026 cohort of 84,200 trials, the read looked like this.
| Trial model | Trial-to-paid conversion | Signup volume | Best fit |
|---|---|---|---|
| Opt-out (card required) | 48% to 60% | Lowest, roughly 30% of opt-in | Established brands, considered buys |
| Reverse trial | 24% to 38% | Medium | Fast time-to-value products |
| Opt-in (no card) | 18% to 25% | High | Simple self-serve tools |
| Freemium | 3% to 5% of active users | Highest | Viral, low-price, wide audience |
Read that top row twice. Opt-out trials can convert ten times higher than freemium. Different agencies report slightly different figures, and that spread is real.
One tracker of 86 SaaS clients puts opt-in at 18.2% and opt-out at 48.8%. A 200-product survey lands lower, near 6% for no-card and 30% for card. The direction never changes, only the magnitude.
Here is our editorial position on the source clash. Agency numbers run higher because they measure their own optimised clients. Broad surveys run lower because they include everyone, including the products doing it badly. Trust the survey for a reality check, trust the agency for a stretch goal.
SaaSGoodies call: we reckon the model gap widens further by year-end, not narrows. As acquisition gets pricier, more teams will trade raw signup volume for the richer conversion a card requirement brings.
The credit card question: fewer signups, far richer conversions
The card at signup is the biggest lever in the whole funnel. It changes who bothers to start.
Ask for a card and the friction-to-cancel starts to outweigh the friction-to-convert. People who hand over card details have already half-decided to buy.
The trade is blunt. Card trials convert roughly three to five times higher. They also produce far fewer signups.
One read puts card-required trials at about 35 signups per 1,000 visitors, against 45 to 90 for softer models. So you win on rate and lose on top-of-funnel size. Here is how the two approaches stack up in practice.
Only about one in five free-trial products currently asks for a card. Given the conversion gap, that number feels far too low to us.
Run the arithmetic and the picture sharpens. A no-card trial with 80 signups at 8% wins the same handful of customers as a card trial with 30 signups at 30%. The card version just does it with cleaner, higher-intent users who stick around.
The catch worth naming: a card wall filters out tyre-kickers, but it also filters out a few genuine buyers who were not ready to commit on day one. Match the model to your price point and buyer.
Our read from the desk: card-required trials become the default for self-serve products above a certain price by the end of 2026. The five-times conversion gap is simply too large to keep ignoring, even at the cost of fewer top-line signups.
How long should a SaaS free trial actually run
Founders obsess over trial length. The data says it matters, but less than you fear.
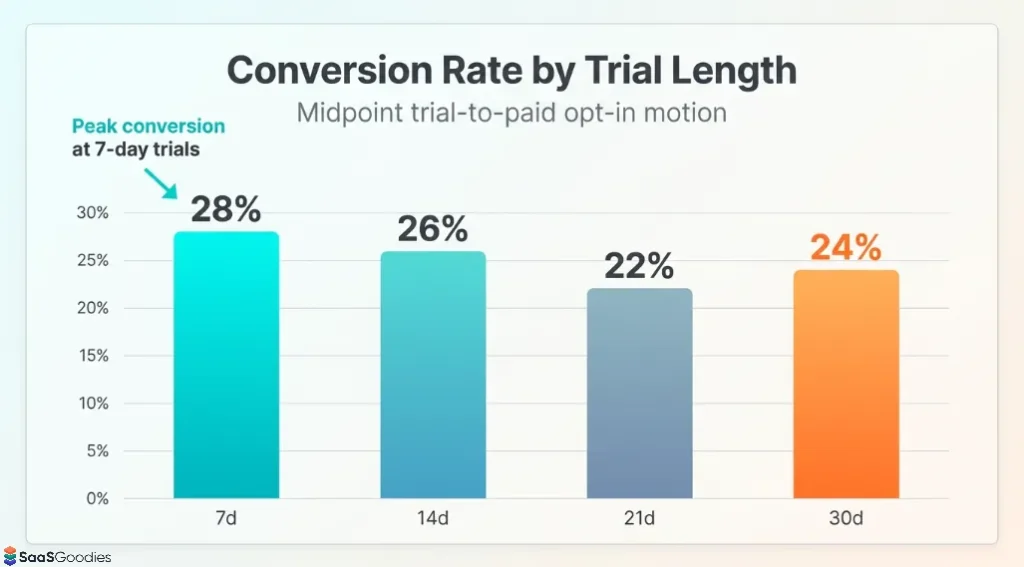
The 14-day trial rules SaaS. Around 62% of products use it, with 7-day and 30-day trials splitting most of the rest at about 14% each.
Why 14 days keeps winning is simple. Two weeks gives most users enough runway to set up and hit a real result, while the countdown still creates urgency.
| Trial length | Share of products | Typical conversion | Best suited to |
|---|---|---|---|
| 7 days | 14% | Up to 25% for simple tools | Fast setup, obvious value |
| 14 days | 62% | 19% to 28% | Most B2B self-serve products |
| 21 days | Small minority | Around 26% | Moderate setup effort |
| 30 days | 14% | 14% to 22% | Complex or enterprise tools |
Longer is not safer. Thirty-day trials often breed procrastination. The user files it under “later” and later never comes.
There is a retention twist too. Seven-day trials can post quick conversions but weaker loyalty. Around 80% of seven-day converters churn inside three months, while 14-day converters show about 22% better retention at the one-year mark.
So the real answer is not a number. It is your time-to-value. Give users just enough time to reach the first real win, then let urgency do its job.
SaaSGoodies take: stop A/B testing trial length before you fix activation. A sharp 7-day trial with strong onboarding beats a lazy 30-day one every time. Length is a lever you pull last, not first.
Free trial vs freemium vs reverse trial: which motion wins
People frame this as a rivalry. It is really a good question. Each motion buys you a different shape of funnel.
Free trials still lead as the primary motion at 57% of products. Freemium sits at 26%. Reverse trials hold a small 7%, but they are climbing fastest.
The funnel maths tells the story. Freemium builds a top of the funnel roughly 40% larger, because “free forever” pulls more signups than a ticking clock. Free trials convert two to three times more of the people who enter. The four common motions each buy a different balance.
Freemium takes far longer to pay off. You often wait three to six months for a free user to upgrade, against under three weeks for a trial. That gap alone reshapes cash flow for an early-stage company.
The reverse trial is the quiet winner of 2026. Users taste the full paid product, then drop to a limited free plan. Loss aversion does the selling for you.
Hybrids are spreading too. Around 65% of product-led teams now stack freemium acquisition with a premium feature trial. Wide funnel at the top, sharper conversion at the point of need.
What we'd bet on: reverse-trial adoption more than doubles off its 7% base within two years. The model captures freemium's reach and the free trial's urgency in one motion. Founders who test it early will bank the easy wins first.
Activation is where most free trials quietly die
Here is the hard truth behind every weak conversion number. Most trials fail at activation, not at the pricing page.
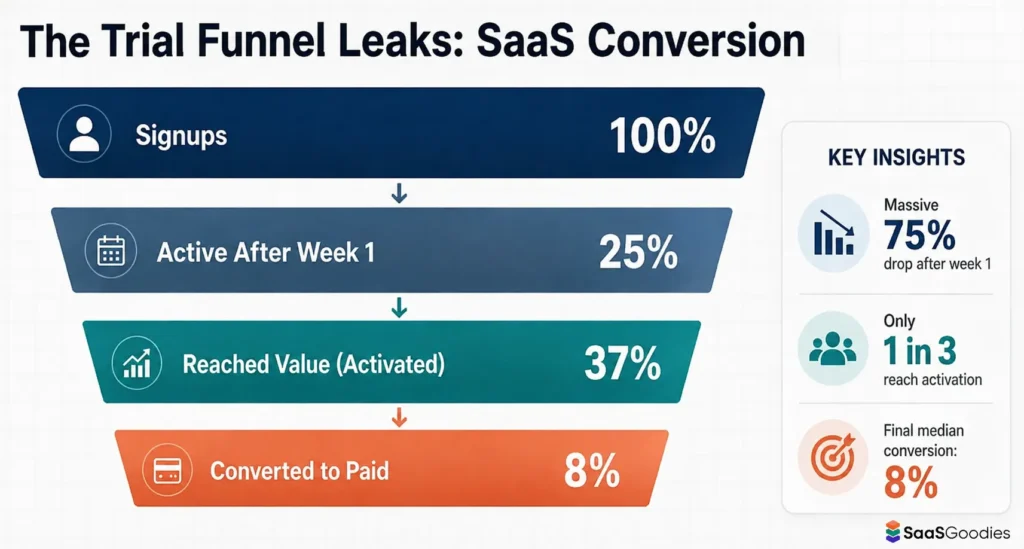
The average SaaS activation rate sits at 37.5%. Read that again. Nearly two-thirds of signups never reach the core value the product promised.
The clock is brutal. About 75% of users churn in their first week. Anyone who does not engage within the first three days carries a 90% chance of churning.
Time-to-value is the metric that quietly rules the trial. Reach the first real win fast and conversion follows. Drag it out and the trial rots in an inbox.
| Activation and onboarding metric (2026) | Figure | Why it bites |
|---|---|---|
| Average activation rate | 37.5% | Sub-40% is the norm, not a crisis you invented |
| Users churning in week one | 75% | The trial is won or lost in days |
| Churn risk with no day-3 engagement | 90% | Silence early means gone |
| Core feature adoption rate | 24.5% | Fewer than one in four uses the main thing |
| Day-1 activation conversion lift | 47% higher | Early wins predict paid intent |
| Top-performer activation rate | Above 50% | Multimedia onboarding does the heavy lifting |
The lever is clear. Push users to their first meaningful action on day one. Guided onboarding, in-app checklists, and milestone nudges move that number more than any discount.
Getting activation from 30% to 60% can roughly double revenue with zero extra traffic. That is why smart teams stopped buying more signups and started fixing the first session.
The aha moment has a clock on it too. In strong trials the first real win lands within the opening session, sometimes inside 18 minutes of signup. Push it past a day and conversion falls off a cliff.
Multimedia earns its keep here. Around 80% of companies clearing a 50% activation rate use video and interactive guides in onboarding, not static help docs. People learn a product faster by doing than by reading.
Our rule of thumb from the accounts we run is simple. Map the shortest path to first value, strip every step that is not on it, then measure how many users reach it on day one.
From our desk: we would fund onboarding before we funded a single extra ad. A 5-point activation gain flows straight through to conversion, and it costs a fraction of the traffic you would need to match it.
Free trial conversion by industry: your niche sets the ceiling
A 15% conversion rate can be brilliant or terrible. The only thing that decides which is your vertical.
Software that solves an obvious, urgent problem converts fast. Tools that demand heavy setup or a buying committee convert slowly, however good they are.
| Industry / category | Free trial to paid | Why the number lands there |
|---|---|---|
| CRM tools | Around 29% | Clear ROI, quick daily utility |
| Education software | 25% to 29% | Defined use case, fast setup |
| Cybersecurity | Around 22% | Urgent need, but heavy onboarding |
| General productivity | Around 21% | Fast value, wide competition |
| Enterprise software | Around 18.6% | Long cycles, committee buys |
| Marketing technology | Around 18% | Results take a full campaign to show |
The B2B versus B2C split is even sharper. B2B trials land between 14% and 25%. B2C trials can reach 57%, because a single person decides and pays in minutes.
The reason is buying friction, not product quality. A B2B trial often needs a champion, a budget holder, and an IT sign-off before anyone pays. A consumer just taps upgrade.
That is also why high-friction categories like cybersecurity and enterprise software sit lower on the table. The value is real, but the setup, integrations, and approvals slow the yes.
Developer tools tend to buck the trend. The person testing the product is usually the same person who decides to keep it, so there is no committee to stall the purchase.
Two famous outliers frame the range. One workplace chat tool has converted freemium users near 30% at the account level. One file-sharing giant built a huge business on roughly 4% freemium conversion, pure volume.
The lesson is not “copy the leader.” It is “compare yourself to your own category, then work the levers that fit your buyer.”
SaaSGoodies read: AI-native tools quietly climb this table through 2026. Faster time-to-value pulls their conversion above traditional peers, even when they run freemium, which usually drags the number down.
How product-led growth turned the trial into the whole funnel
The free trial is no longer a marketing add-on. Under product-led growth it is the marketing, the sales demo, and the product proof rolled into a few days.
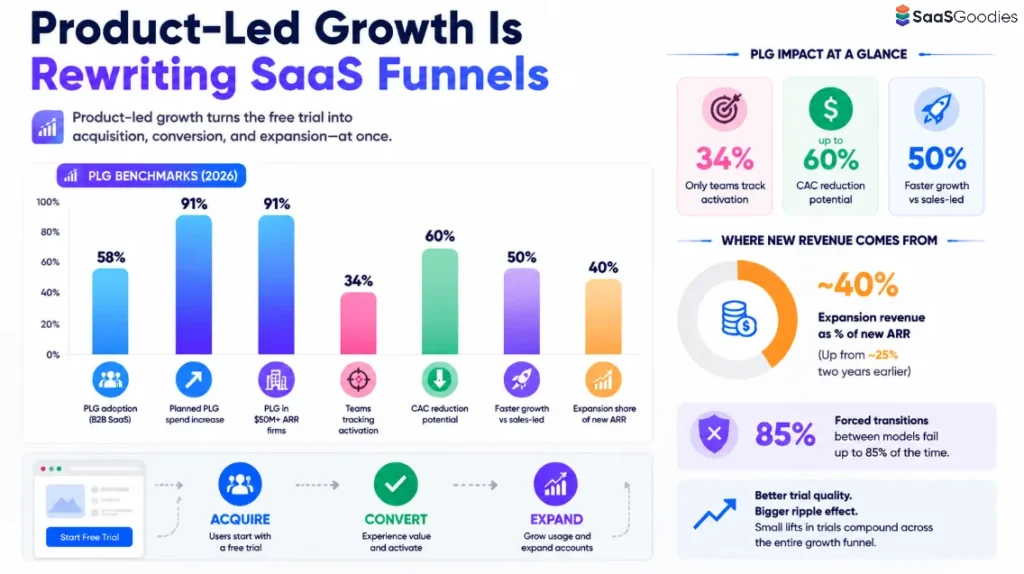
Adoption is now mainstream. Around 58% of B2B SaaS companies run some form of PLG motion, and about 91% plan to spend more on it.
Among larger companies the shift is near total. Roughly 91% of B2B SaaS firms above $50 million ARR have a PLG motion in place.
| Product-led growth metric (2026) | Figure | Signal for trials |
|---|---|---|
| B2B SaaS running a PLG motion | 58% | Trials are now the main entry point |
| Planning to increase PLG spend | 91% | Budget is moving into the product |
| Companies that track activation | Only 34% | Most fly blind on the key trial metric |
| CAC cut from product-led onboarding | 25% to 60% | Self-serve trials pay for themselves |
| PLG growth speed vs sales-led | 50% faster | On roughly 39% less spend |
| Expansion share of new ARR | Around 40% | Up from 25% two years earlier |
Here is the gap that hands you an edge. Only 34% of PLG teams actually track activation. Most run trials without measuring the one number that predicts conversion.
The payoff for getting it right is real. Product-led onboarding can cut acquisition cost by a quarter to well over half, because the product does the selling.
There is a warning buried in the data too. Forced transitions between models fail often, with reported failure rates as high as 85%. Do not rip out a working motion on a whim.
The expansion story matters as well. Revenue from existing accounts now makes up close to 40% of new ARR, up from around 25% two years ago. A good trial does not just win a customer, it seeds the upsell.
That reframes the whole job. Under a product-led motion the trial feeds acquisition, conversion, and expansion at once, so a small lift in trial quality echoes through every later metric.
SaaSGoodies call: activation tracking crosses 50% of PLG teams within two years. The ones building it now will spot their trial leaks first and fix them while rivals are still staring at signup counts.
What actually lifts free trial conversion in 2026
Enough diagnosis. Here is what actually moves the number, ranked by the pull we see across the accounts we run and review.
One more figure to keep you honest. A single percentage point of conversion gain produces roughly 15% more new revenue per trial cohort. Small wins here are not small.
Speed of follow-up matters as much as the trial itself. When a trial user signals intent, respond in minutes, not days. Momentum is the whole game inside a two-week window.
What we'd prioritise: fix fit and first-session value before touching anything else. Those two levers move conversion more than pricing tweaks, trial length changes, and email cadence combined.
The real cost of a leaky free trial
Founders love talking about conversion rate. Fewer talk about what a weak one actually burns.
Think of a product spending £700 to acquire each customer. If 75% abandon in week one, most of that spend leaves with them.
The maths is unforgiving. On a poor onboarding flow, well over half of every acquisition pound produces no return at all. You paid for the click and never got the customer.
Now flip it. Because a single point of conversion is worth roughly 15% more new revenue per cohort, fixing a leaky trial pays back faster than almost any other growth project.
Picture 1,000 trial signups. At a weak 8% conversion you win 80 customers. Lift the rate to a healthy 15% and you win 150. Reach an opt-out level of 30% and you bank 300, from the very same traffic.
The jump from 8% to 15% almost doubles paying customers with no extra ad spend. Getting there rarely needs a new channel. It needs better fit and faster activation.
That is why we keep steering founders away from “buy more signups” and toward “convert the ones you have.” The cheaper win is almost always inside the funnel you already own.
There is a retention layer on top. Users who convert after reaching real value stick around longer, so a well-run trial lifts both new revenue and lifetime value at once.
What we keep repeating to clients: a leaky trial is a tax you pay on every ad you buy. Plug the leak first, then scale traffic. Doing it the other way round just makes the tax bigger.
Our honest read on where free trials head next
We have shipped a lot of stats posts. Here is what we would actually act on this year, in plain terms.
The model choice is the strategy. Freemium for reach, opt-in for balance, opt-out for revenue efficiency, reverse for the best of both. Pick on purpose, not by default.
Activation is the real conversion metric. Signups feel like progress and mostly are not. The first session decides the money.
Cards are underused. One in five products asks for one, and the conversion gap says far more should. Match the ask to your price and buyer.
And the reverse trial is the motion to test this year. It quietly beats the older models on the balance of reach and conversion, and most of your rivals have not tried it yet.
None of these SaaS free trial statistics live in a vacuum. Treat every figure here as a starting benchmark, then tune against your own price, buyer, and time-to-value. The numbers above are the ones we are betting on for the rest of 2026.
Frequently asked questions
What is a good free trial conversion rate in 2026?
It depends entirely on your model. No-card trials convert well at 10% to 15%. Card-required trials are strong at 25% to 35%, and great above 50%. Freemium doing 3% to 5% is normal and healthy.
What is the median SaaS free-to-paid conversion rate?
Across a 2026 survey of 200 B2B products, the median sits at 8%. The spread is huge, though. Around 20% of products convert below 2.5%, while about a quarter clear 25%.
Do credit-card trials really convert better?
Yes, by a wide margin. Card-required trials convert roughly three to five times higher than no-card trials. They also produce far fewer signups, so the model is a trade, not a free lunch.
What is the best free trial length for SaaS?
Fourteen days works for most products and is used by about 62% of them. Simple tools can win with 7 days. Complex or enterprise products sometimes need 30. Your time-to-value should decide.
Is freemium or a free trial better?
Freemium builds a funnel roughly 40% larger but converts thinly, over months. Free trials convert two to three times more of the people who enter, and far faster. Reverse trials try to capture both strengths.
Why do most free trials fail to convert?
Activation, not pricing. The average activation rate is 37.5%, and about 75% of users churn in week one. Users who never reach core value rarely pay, regardless of trial length or discount.
How much does product-led growth affect trials?
A lot. Around 58% of B2B SaaS now run PLG, and product-led onboarding can cut acquisition cost by 25% to 60%. Under PLG the trial becomes the main acquisition and conversion engine.
- ChartMogul and ProductLed, SaaS Conversion Report (200 B2B products)
- First Page Sage, SaaS Free Trial Conversion Benchmarks
- Statista, SaaS and Software Market Data
- OpenView Partners, Product-Led Growth Index
- Userpilot, SaaS Average Conversion Rate and Activation Benchmarks
- G2, SaaS Buyer Behaviour Research
- Gartner, Software Spending and SaaS Forecasts
- Bessemer Venture Partners, State of the Cloud