Email Automation Statistics 2026: 2% Sends, 30% Cash

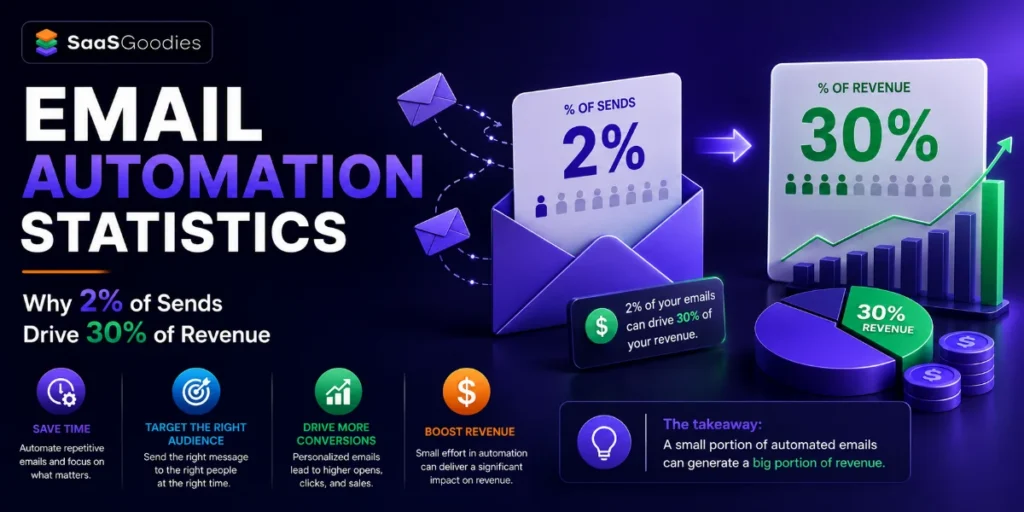
One statistic should change how every email team spends its week: automated emails make up roughly 2% of all email sends but drive about 30% of email revenue, earning 16 times more per send than scheduled campaigns.
Most teams spend 70–80% of their time on the campaigns — the part that makes the least money.
Email automation is the use of behaviour-triggered email flows — welcome series, abandoned-cart reminders, post-purchase sequences — that fire automatically when a subscriber takes an action, as distinct from the batch-and-blast campaign sent to a list on a schedule.
The timing is what makes them work: the email lands while the action is fresh. We've pulled up the verified Email automation statistics on performance, the highest-earning flows, ROI, market size and AI's growing role — drawn from platform datasets covering tens of billions of emails.
Top Email Automation Statistics: A Quick Snapshot
What is Email Automation, and How Does it Differ from Campaigns?
Email automation refers to behaviour-triggered email flows that fire automatically based on what a subscriber does — joining a list, browsing a product, abandoning a cart — as opposed to campaigns, which are sent to segments on a fixed schedule. The distinction is not cosmetic; it is the entire reason automation outperforms.
The whole performance gap comes down to one word: timing.
Translation for operators: a great campaign fights for attention; a great flow shows up exactly when attention already exists. That is why the rest of these numbers look the way they do.
How Much Revenue Does Email Automation Actually Drive?
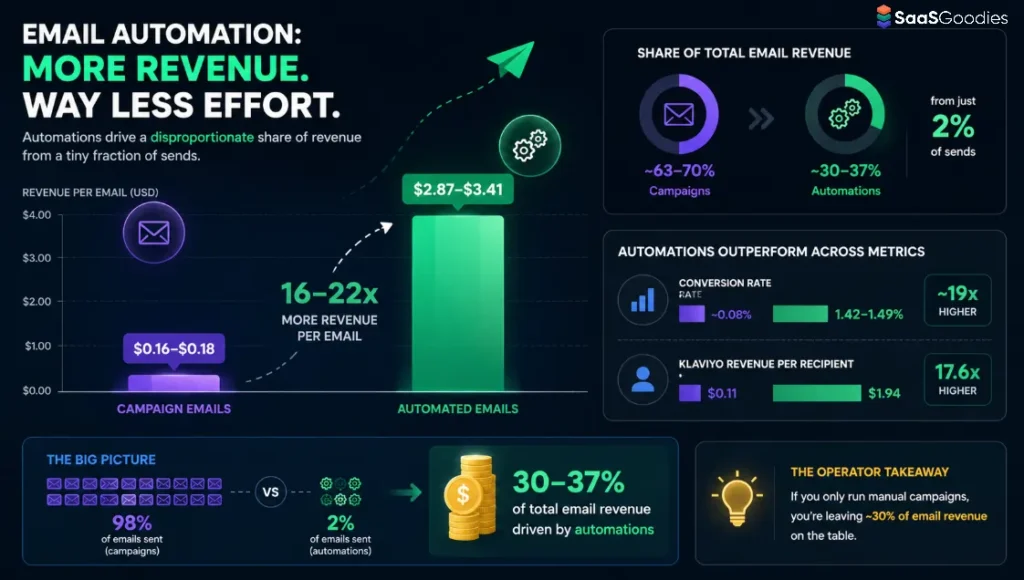
Automated flows produce roughly 30–37% of all email revenue while making up only about 2% of total send volume — the most lopsided efficiency ratio in marketing. The exact figure varies by platform and year, but the direction never does.
| Metric | Campaign emails | Automated emails | Gap |
|---|---|---|---|
| Revenue per email | $0.16–$0.18 | $2.87–$3.41 | 16–22× |
| Conversion rate | ~0.08% | 1.42–1.49% | ~19× |
| Klaviyo revenue per recipient | $0.11 | $1.94 | 17.6× |
| Share of total email revenue | ~63–70% | ~30–37% | from 2% of sends |
The reason these figures differ slightly is methodology — Omnisend and Klaviyo measure different brand sets — but both land on the same structural truth.
SaasGoodies Insight: If a list runs only manual campaigns, the missing 30% of revenue is sitting in flows nobody has built yet. Set up welcome and cart recovery first.
Which Automated Flows Make the Most Money?
The single highest-earning flow is the one almost nobody runs: back-in-stock emails earn $9.14 per email and convert at 6.72%, yet only 0.6% of brands use them. The flow league table is where the real opportunity gaps hide.
| Automated flow | Revenue per email | Conversion rate | Notes |
|---|---|---|---|
| Back-in-stock | $9.14 | 6.72% | Used by only 0.6% of brands |
| Welcome | $6.16 | — (35.53% open) | Highest-intent moment |
| Abandoned cart | $3.59 | — | Used by 22.5% of brands |
| Birthday | — | — | AOV $744.37 (~4× normal) |
| Customer reactivation | $0.51 | 0.54% | Value is list hygiene |
The honest caveat: back-in-stock only applies to brands that sell out of products, so its 0.6% usage partly reflects relevance, not pure neglect — but for any store with stock cycles, it is free money left on the table.
SaasGoodies Tip: build the two cash flows (welcome, cart) first, then check whether back-in-stock or browse abandonment fits the catalogue. The cheapest revenue is a flow a competitor forgot.
What is The ROI of Email and Automation Specifically?
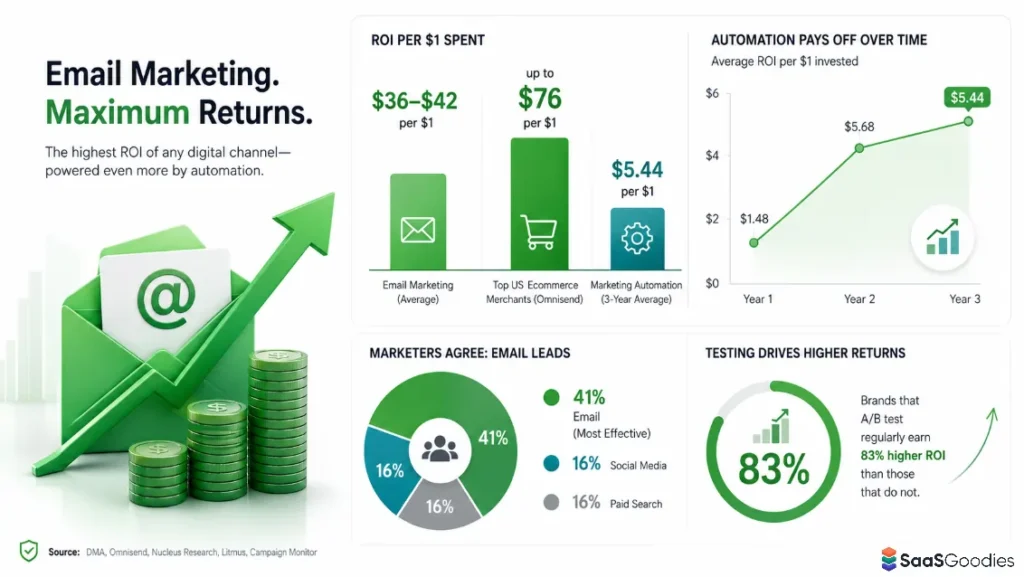
Email marketing returns $36 to $42 for every dollar spent, the highest of any digital channel — and that average is dragged down by the brands not using automation. The ROI case is the most-cited stat in marketing for a reason: it keeps holding up.
| Metric | Return |
|---|---|
| Email marketing (average) | $36–$42 per $1 |
| Top US ecommerce merchants | up to $76 per $1 |
| Marketing automation (3-yr) | $5.44 per $1 |
The honest framing: that $36 figure is a blended average, so a brand running strong flows beats it comfortably while a campaign-only sender falls below.
SaasGoodies Take: “email does $36 per $1” is the floor, not the ceiling — and automation is the difference between the floor and the $76 top performers hit.
How do Automated Emails Perform Versus Broadcast Campaigns?
On every engagement metric, automation wins — but the open-rate gap is the least trustworthy number on this page, because Apple Mail Privacy Protection inflates it. Read opens with suspicion; read conversion and revenue as the truth.
This is the contrarian truth the dashboards bury: a rising open rate in 2026 is closer to a measurement artefact than a win.
How Big is The Email Automation Market?
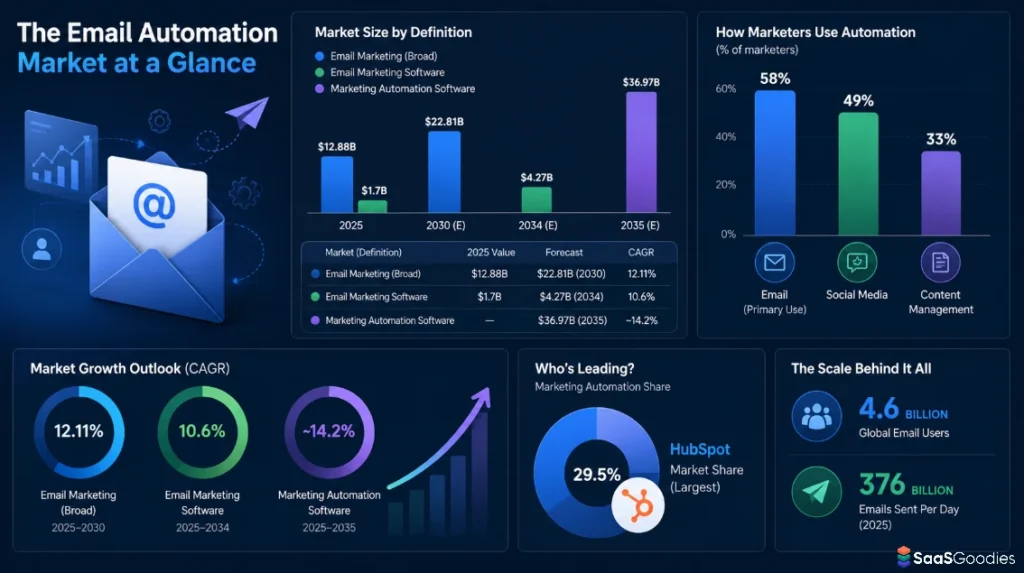
The email marketing market is worth roughly $13 billion in 2026 and on track to double by 2030 — and email is the most common single use case for marketing automation overall. Estimates vary widely by definition, so here is the honest spread.
| Market (definition) | 2025 value | Forecast | CAGR |
|---|---|---|---|
| Email marketing (broad) | $12.88bn | $22.81bn (2030) | 12.11% |
| Email marketing software | $1.7bn | $4.27bn (2034) | 10.6% |
| Marketing automation software | — | $36.97bn (2035) | ~14.2% |
The spread between a $1.7 billion “software-only” figure and a $13 billion “full ecosystem” figure is pure definition — narrow counts licences, broad counts the whole stack.
How is AI Changing Email Automation?
AI has moved from novelty to default, with around 63% of marketers now using generative AI and personalised, AI-optimised sends measurably outperforming static ones. This is the fastest-shifting part of the category.
The reality check: many AI-uplift figures come from vendor surveys of marketers already invested in the tools, so treat the headline percentages as directional.
SaasGoodies Take: AI's reliable win in 2026 is not magic copy — it is better timing and segmentation at scale. Start there before chasing the flashier claims.
The Bottom Line on Email Automation Statistics in 2026
The data converges on one conclusion, with three honest caveats.
Automation is the highest-leverage move in email, full stop. A 2% slice of sends producing 30–37% of revenue is not a marginal edge. The caveat: flows still need good offers, copy and product relevance — automation adds timing on top of fundamentals, it does not replace them.
Stop trusting open rates. With Apple MPP inflating the 30.7% average, opens are now closer to noise than signal. The caveat: opens still have narrow uses (deliverability monitoring, relative A/B comparison on the same audience) — they are just useless as an absolute performance measure.
The opportunity is in the flows nobody runs. Back-in-stock at $9.14 per email used by 0.6% of brands, browse abandonment, post-purchase — these are where the next revenue sits. The caveat: relevance gates them, so match the flow to the business model rather than building all of them blindly.
- Omnisend — 2026 Ecommerce Marketing Report: benefits of email automation (2% of sends / 30% of revenue; flow share).
- Omnisend — Email marketing benchmarks 2026 (revenue per email by flow; campaign vs automation; MPP note).
- Omnisend — Email marketing statistics 2026 (automation open/revenue; behavioural triggers).
- Omnisend — Ecommerce email marketing (click-to-conversion; channel effectiveness).
- Klaviyo 2026 benchmarks (183,000+ brands) — flows vs campaigns (via Geysera).
- Litmus / Omnisend — email marketing ROI (via That Marketing Buddy).
- Mordor Intelligence — Email Marketing Market size (via Shno).
- Fortune Business Insights — Email Marketing Software Market.
- Precedence Research — Marketing Automation Software Market.
- Market.us (via Bayelsa Watch) — marketing automation usage and platform share.
- Nucleus Research (via AffTank) — marketing automation ROI.
- HubSpot State of Marketing (via SaaS Ultra) — segmentation and personalisation.
- Salesforce (via Market Research Future) — predictive send-time optimisation.
- Shno — email automation statistics roundup (Omnisend/Klaviyo primary figures).