SaaS Statistics 2026: Market Size, Growth, Churn & Trends

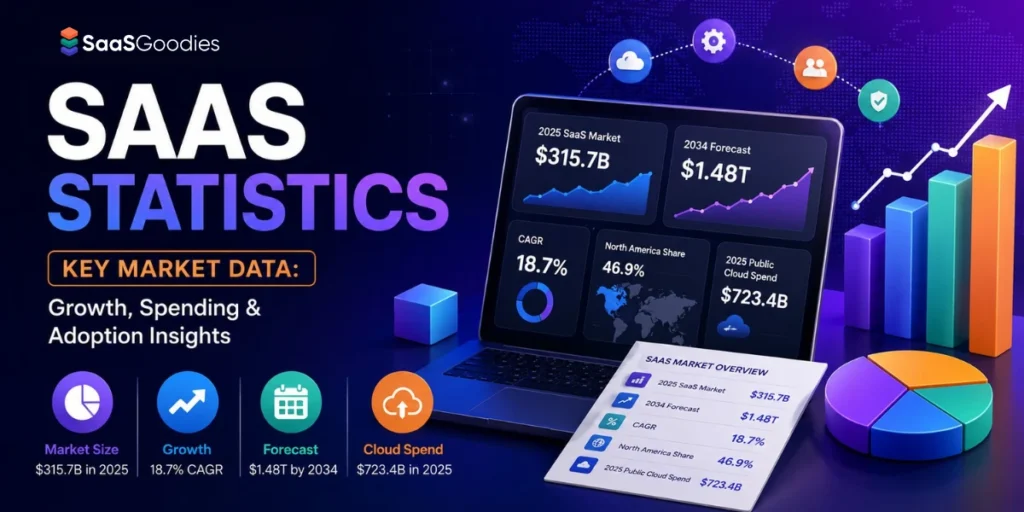
Quick answer: The global SaaS market remains comfortably above $400 billion in 2026, with adoption now close to universal across businesses.
Companies are spending more on software, but they are also reviewing unused licences, consolidating overlapping tools and demanding clearer returns from every renewal.
The average SaaS portfolio now contains hundreds of applications, while pricing, churn and retention vary sharply between SMB, mid-market and enterprise vendors.
These SaaS statistics for 2026 cover the numbers that matter most: market size, adoption, company count, spending, licence waste, churn, pricing and regional growth.
SaaS Statistics 2026: The Snapshot
We pulled the headline figures into one place. No fluff, just numbers.
| Metric | 2026 figure | SaasGoodies read |
|---|---|---|
| Global SaaS market size | ~$400B+ (band of $375B to $465B) | Strong growth, but the count depends on definition |
| Active SaaS companies worldwide | 30,800+ | Roughly 17,000 sit in the United States |
| Average apps per organisation | 291 | Large firms run 473 each |
| Unused SaaS licences | 51% | About $18M wasted per big enterprise yearly |
| Companies using at least one SaaS app | 99% | Near-total saturation |
| Per-seat pricing share of vendors | 15% | Down from 21% in a single year |
| Median B2B monthly churn | 3.5% | SMB bleeds fast, enterprise barely moves |
| AI agents inside enterprise apps | 40% | Up from under 5% in 2023 |
That table sets the scene. Now we break each line apart.
How Big Is The SaaS Market In 2026?

Big. And messy to measure. Every research house counts SaaS differently. Narrow counts land near $375 billion. Wider counts push past $465 billion. A few stretch toward $512 billion once you fold in every public-cloud app.
Our blended read for 2026: the subscription software market sits comfortably above $400 billion, and we lean toward the $465 billion mark by year-end. That gap matters less than the trend. The trend points one way. Up and to the right, fast.
Here is the year-by-year climb on a single consistent series, so you can track the slope without mixing apples and oranges.
| Year | Global SaaS market size | Notes |
|---|---|---|
| 2023 | $273.55B | Post-pandemic baseline |
| 2024 | ~$294B | Steady climb |
| 2025 | $315.68B | Cloud-first budgets win |
| 2026 | $375.57B (narrow) / ~$465B (broad) | AI tiers add fresh revenue |
| 2027 | ~$450B (est.) | Our projection |
| 2030 | ~$790B | Approaching the trillion mark |
| 2032 | $1.2T+ | Past one trillion |
| 2034 | $1,482.44B | Nearly five times the 2023 size |
A few quick reads on those numbers:
SaasGoodies Projection: We expect the broad SaaS count to cross half a trillion dollars by 2027. AI add-on revenue gets us there sooner than most forecasts assume.
How Many SaaS Companies Exist Now?
More than 30,800 SaaS companies operate worldwide in 2026. Around 17,000 of them call the United States home.
That number keeps climbing. Some forecasts say the global count could more than double, reaching 72,000 over the next stretch of years.
Why so many? Low build costs. AI coding tools. Cheaper cloud. A solo founder can ship a working app in a weekend now. We see fresh micro-SaaS brands launch daily across the niches we cover.
SaaS Adoption: Almost Everyone Uses It
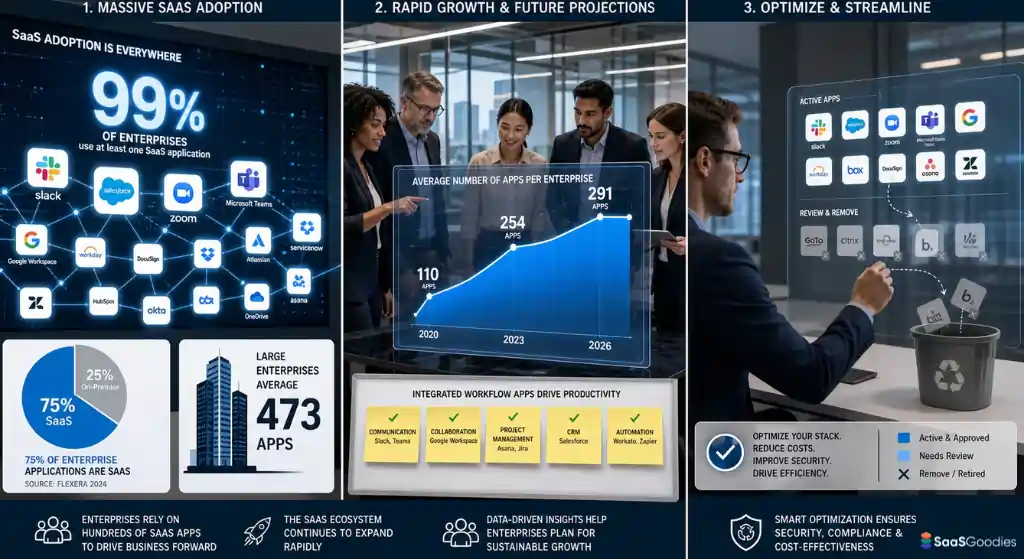
Adoption is basically maxed out.
App growth is slowing, though. Mid-sized firms actually trimmed their stacks in 2025. Sprawl peaked. Now teams cut waste instead of piling on more tools.
That shift changes what wins. Stickiness beats novelty. We see it in our own reviews: tools that bury themselves in daily workflow keep customers. Shiny one-trick apps get cancelled at renewal.
The $18 Million Money Pit: Wasted SaaS Licences
Roughly 51% of enterprise SaaS licences go unused. That waste rate ranks as the highest ever recorded. For a single large enterprise, the wasted spend works out near $18 million a year.
The breakdown gets worse when you look closer:
SaasGoodies Take: This waste is the quiet crisis of 2026. Finance teams finally noticed. Renewals now get scrubbed line by line. Any tool that cannot prove daily use gets cut. We expect license-reclaim software to boom this year as a result.
AI Is Now a Standard SaaS Feature
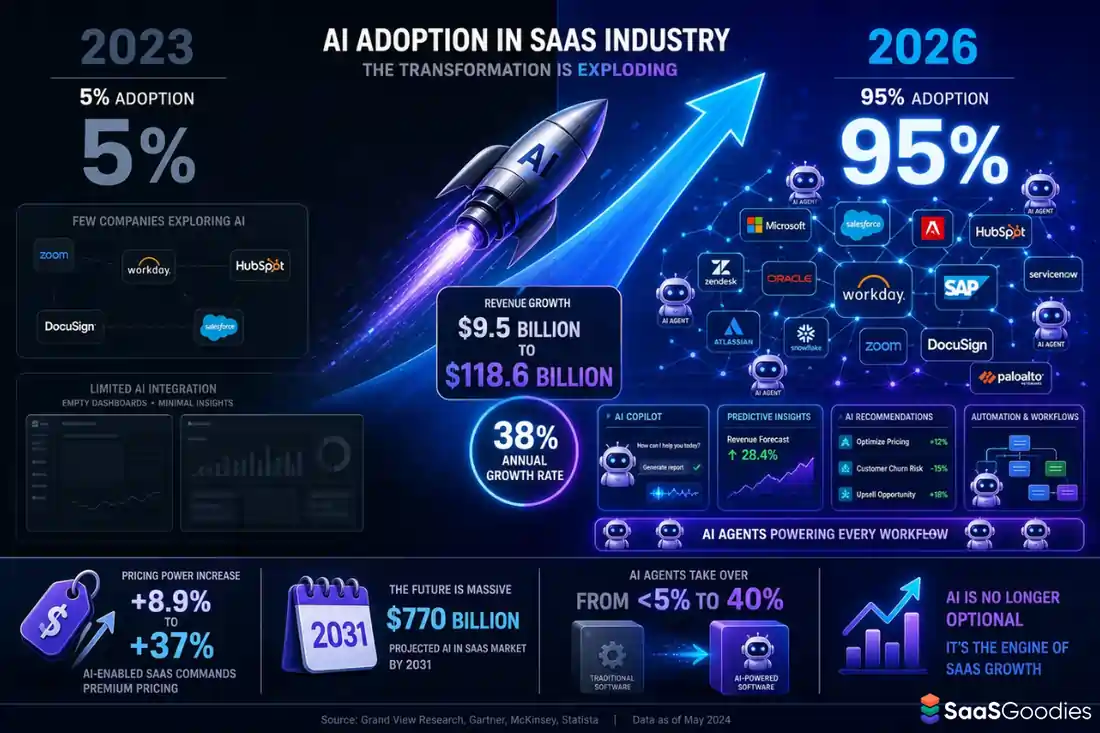
AI has moved from an optional add-on to a standard part of the SaaS stack.
More than 80% of large companies now use AI-powered SaaS applications, while AI agents are expected to appear in around 40% of enterprise software by the end of 2026. The AI SaaS segment is also growing close to 38% annually, far faster than the wider SaaS market.
That growth comes with higher costs. Vendors increasingly bundle AI into existing plans, introduce usage limits or add separate credit charges. Some businesses are already reporting noticeable AI-related increases at renewal.
For SaaS buyers, the question is no longer which tools offer AI. It is whether the AI feature produces enough value to justify the higher price.
For detailed figures on AI-native software, agent adoption, usage-based billing and enterprise ROI, read our complete AI SaaS Statistics report.
SaaSGoodies forecast: Nearly every serious B2B SaaS product will offer an AI-powered workflow or agent by the end of 2026. Vendors that cannot prove useful AI outcomes will struggle to defend higher prices.
Per-Seat Pricing Is Cracking
Twenty years of SaaS ran on one idea. More staff, more seats, more revenue. AI agents broke that maths in a single step.
Agents do not log in. They hold no licence. One agent can clear the workload of ten people. So why pay per human seat?
The data shows the shift in real time:
Outcome-based pricing is the boldest move. You pay only when the AI delivers a result.
| Pricing model | Vendor share trend | Best example |
|---|---|---|
| Per-seat | 21% to 15% (falling) | Classic CRM and productivity tools |
| Usage-based | 30% (2019) to ~85% of AI-native | API and infrastructure tools |
| Hybrid (base plus usage) | 27% to 41% (rising) | Most enterprise renewals in 2026 |
| Outcome-based | New and growing | Support AI charged per resolved ticket |
| Credit-based | Emerging | Design and creative AI tools |
Real outcome prices live in market now:
Hybrid wins for a reason. Firms using it report around 38% higher revenue growth and 38% higher net revenue retention than pure-subscription peers. Hybrid adoption could hit 61% of SaaS vendors by the close of 2026.
SaasGoodies view: pure per-seat keeps shrinking, but it will not vanish. Buyers crave predictable bills. So hybrid stays the safe middle ground through 2027. We track every pricing-page change across the tools we list, because a model swap can double your real cost.
AI agents are accelerating the move toward usage and outcome-based billing. We cover current agent prices, enterprise adoption, vendor examples and ROI benchmarks in our complete AI SaaS Statistics for 2026 report.
SaaS Churn And Retention Benchmarks 2026
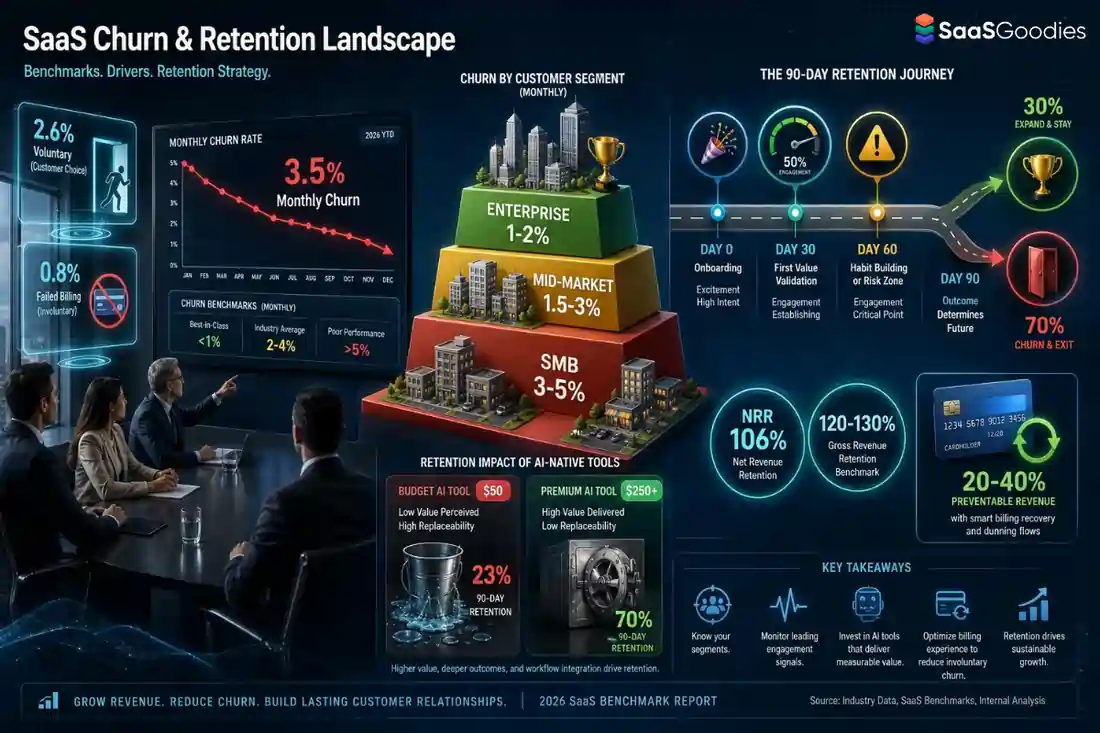
Churn became a valuation weapon in 2026. Boards watch it harder than growth now.
The median B2B SaaS monthly churn rate sits at 3.5%. Of that, roughly 2.6% comes from voluntary cancels and 0.8% from failed billing.
But one blended number hides the real story. Segment matters more than anything.
| Segment | Monthly churn | Annual churn (compounded) | NRR range |
|---|---|---|---|
| Enterprise (ACV $100K+) | 1% to 2% | Under 5% | 115% to 125% |
| Mid-market ($15K to $100K) | 1.5% to 3% | 5% to 10% | ~108% |
| SMB (under $15K) | 3% to 5% | 31% to 58% | 90% to 105% |
| B2C / prosumer | 4% to 7% | Very high | Often under 100% |
| AI-native (budget, under $50/mo) | Highest | Brutal | 32% net retention |
| AI-native (premium, over $250/mo) | Low | Healthy | 85% net retention |
Some sharp reads on those churn numbers:
There is a bright spot. AI-native retention climbed through 2025 as the curious tourists churned out and committed users stayed. Median AI-native gross retention rose from 27% to 40% across that year.
SaasGoodies Tip: If a tool charges under $50 and leans on AI hype, expect heavy churn behind the marketing. We weigh retention heavily in our rankings for that reason.
How Much Do Companies Spend On SaaS?
A lot. And the bill keeps rising even as app counts flatten.
Notice the disconnect. App sprawl stopped growing, yet spending keeps climbing. Pricing complexity, AI charges, and usage overages now drive cost more than new tools do. Surprise charges hit outside the normal budget cycle.
That is why shadow IT spending and renewal discipline became board-level topics. Visibility now beats expansion as the smart 2026 play.
Where The SaaS Money Lives: Regions
North America still rules. But other regions move fast.
| Region | Share of global SaaS revenue | 2026 note |
|---|---|---|
| North America | 46.9% | US market alone near $141B (narrow count) |
| Europe | ~25% | Steady, privacy-driven demand |
| Asia-Pacific | 20% | Fastest AI investment growth |
| Middle East / North Africa | Growing | IT spend near $169B, up 8.9% |
| Latin America | Small but rising | Cloud growth above 20% yearly |
A few extra regional numbers worth a glance:
- 96% of ASEAN organisations plan to lift AI investment in 2026.
- MENA software spend should grow 13.9% in 2026, reaching $20.4 billion.
- Australia's total IT spend should hit A$172.3 billion, up 8.9%.
SaasGoodies Projection: Asia-Pacific closes the gap on Europe before 2028. AI-tool adoption there grows faster than anywhere else we track.
Vertical SaaS Beats Horizontal SaaS
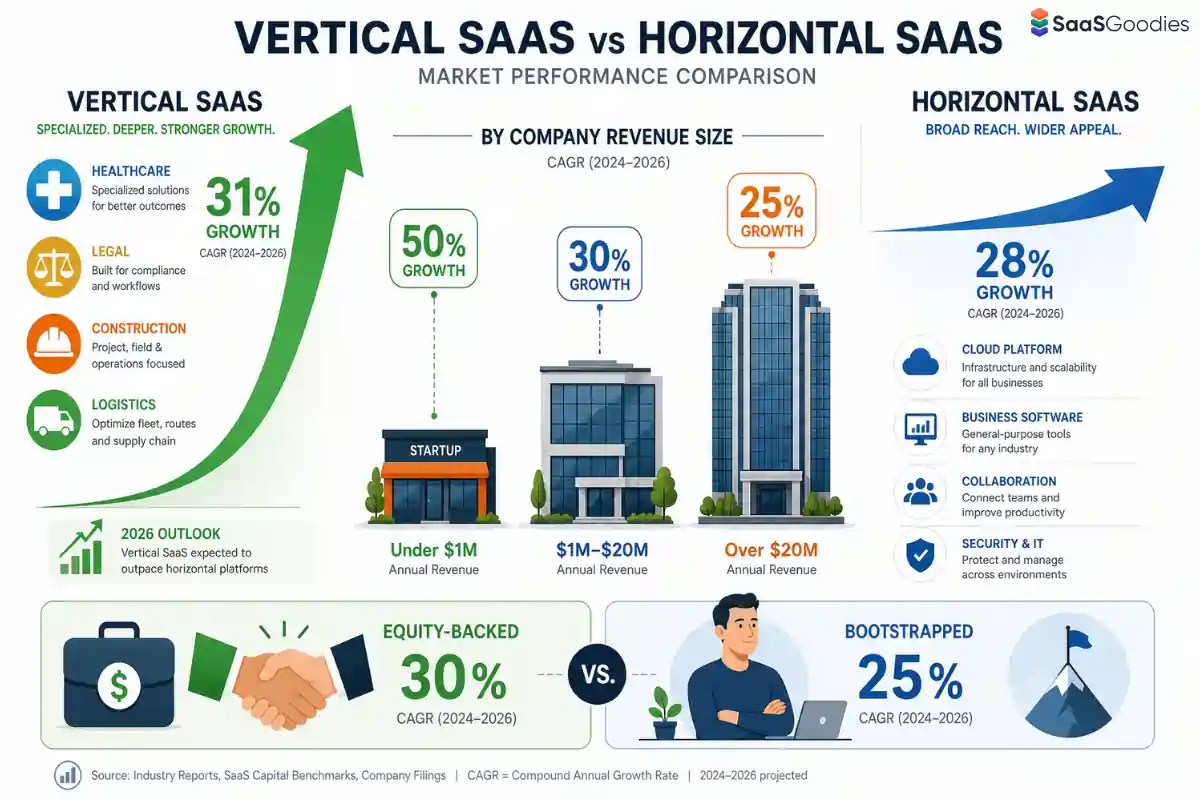
Niche tools now outgrow the all-purpose giants.
Vertical SaaS growth ran at 31% versus 28% for horizontal players. Across the broader market the gap widens to 24% versus 16%.
Why? Vertical tools solve one industry's pain perfectly. Healthcare, legal, logistics, construction. Switching costs run high. Churn runs low. Buyers stay loyal.
Growth also splits sharply by company size:
We expect vertical SaaS to keep winning through 2026. Specialised beats generic when AI makes building easy and trust becomes the moat.
The 2026 SaaS Shake-Up
Early 2026 brought a jolt. Investors repriced software stocks in days over one fear: AI agents shrinking seat counts.
The numbers from that sell-off:
The lesson is not that SaaS is dying. The lesson is that headcount-priced software faces real pressure. Value now ties to work done, not seats filled.
SaasGoodies Read: The brands that survive treat themselves as the workspace where AI agents, automations, and humans meet. Everything else becomes a plug-in. We rank consolidation-proof tools higher because of exactly this.
SaaS Consolidation And M&A
Buying activity stayed hot in 2026.
The market splits in two directions at once. Enterprises trim overall sprawl while still adding niche vertical tools. Consolidation and fragmentation live side by side.
Shadow IT And SaaS Security
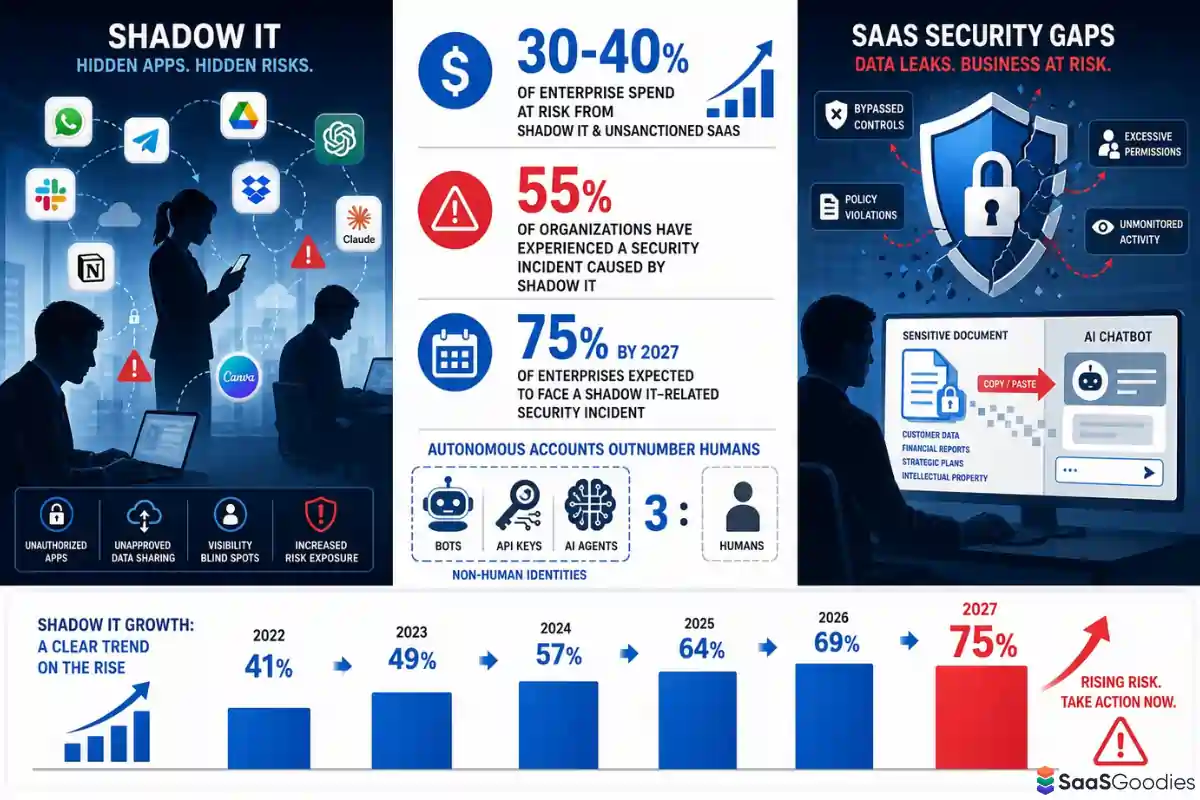
Unsanctioned tools are a growing headache.
AI made this riskier. Staff paste sensitive data into random AI tools with no oversight. Security teams flag 2026 as the year shadow AI became a board worry. Governance now ranks among the top buying criteria.
SaasGoodies Predictions For 2026 And Beyond
Time for our own calls. These are estimates, built from the numbers above plus what we see across the tools we review daily.
- We project the broad SaaS market will clear $500 billion before the end of 2027.
- We expect hybrid pricing to pass 60% of vendors by late 2026.
- We forecast that license-reclaim and SaaS-management tools grow fastest among all categories this year, driven by that 51% waste rate.
- We think AI-native budget tools keep churning hard until they raise prices past the $50 mark.
- We predict vertical SaaS outpaces horizontal every year through 2028.
- We estimate per-seat pricing drops below 10% of new SaaS launches by 2027.
Take these as our working view, not gospel. We update them as fresh data lands.