SaaS Pricing Statistics 2026: Trends, Costs & Benchmarks

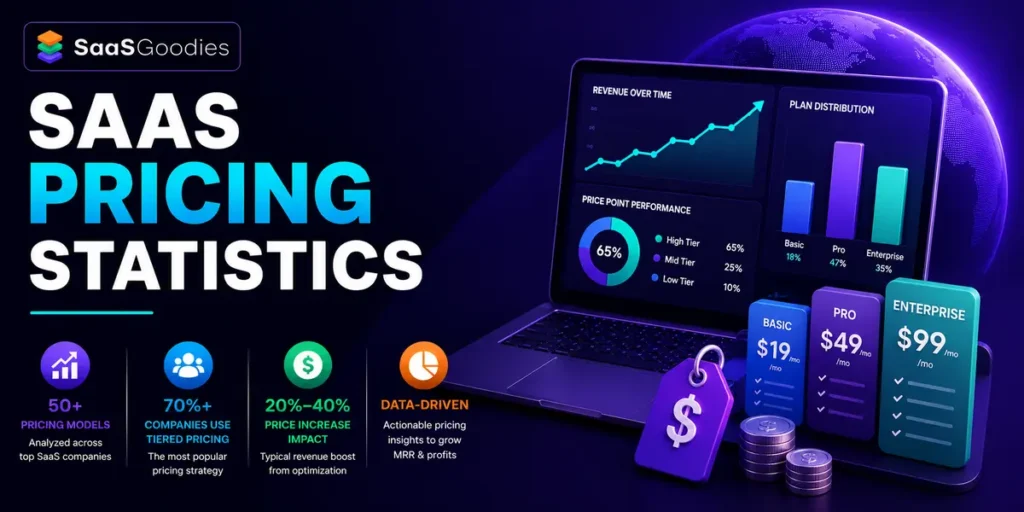
For years, SaaS pricing felt fairly simple: choose a monthly price, create three plans and offer an annual discount. That playbook no longer holds. Software costs are climbing, seat-based plans are losing ground and buyers want a clearer link between what they pay and the value they receive.
The numbers tell a costly story. Businesses now spend about $10,800 per employee on software, while list prices rise by 8% to 12% each year. Unused licences continue to drain company budgets. At the same time, usage-based pricing, hybrid pricing models and value-based pricing are changing how SaaS companies protect margins and how customers forecast their bills.
These SaaS pricing statistics bring together the latest data on market growth, average SaaS spend, free-trial conversion rates, discounting, churn and pricing-page transparency. If you set software prices, negotiate renewals or plan a 2026 technology budget, the benchmarks below show what is changing and which numbers deserve your attention.
SaaS Pricing in 2026: The Money Picture at a Glance
Let us set the scene before the model debate. Software got pricier, and it got harder to predict.
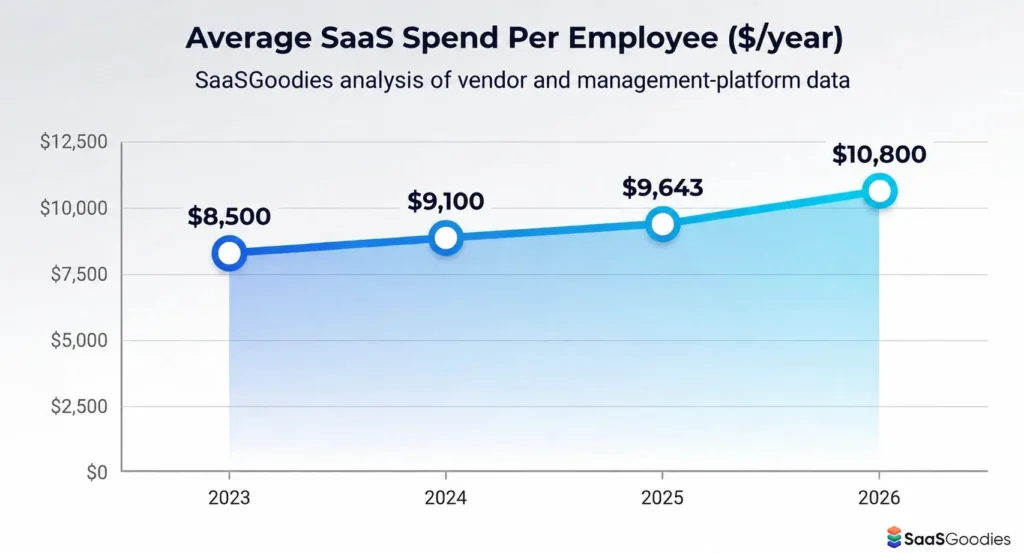
Businesses now spend roughly $10,800 per employee per year on SaaS. That figure sat near $8,500 in 2023 and $9,643 in 2025. So the average SaaS spend per employee keeps climbing about 12% a year with no sign of a plateau.
The wider market backs that up. Global SaaS revenue lands around $375 billion to $400 billion in 2026, growing near 15% to 19% depending on who counts. SaaS now eats 35% to 45% of most IT budgets, up from a quarter of the budget back in 2020.
Here is the part that stings. SaaS inflation runs near 12% a year, roughly five times general market inflation. A typical company juggles around 305 apps, and a quarter to a third of those licences sit unused. That waste alone tops $45 billion worldwide.
A few headline numbers we keep coming back to:
| Market metric (2026) | Figure | What changed |
|---|---|---|
| Global SaaS market revenue | $375B to $400B | Growing 15% to 19% a year |
| Average SaaS spend per employee | $10,800 | Up from $9,643 in 2025 |
| SaaS inflation rate | 12% | Roughly 5x general inflation |
| Apps managed per company | 305 | Portfolio counts flattening |
| Unused or under-used licences | 25% to 30% | $45B wasted worldwide |
| Share of IT budget on SaaS | 35% to 45% | Up from 25% in 2020 |
Our call: we reckon per-employee spend clears $11,500 by the close of 2026. AI features get bolted onto tools buyers already pay for, and few teams retire old apps. That combination keeps the bill rising even when app counts hold flat.
Per-seat is Fading, Usage and Hybrid Pricing are Winning
This is the big story in the numbers. The old default, one price per user, is losing ground fast.
Per-seat still shows up everywhere. Roughly 58% of products keep a seat component, and about 67% run some tiered structure. So seats are not dead. Pure seat-only plans are the ones in trouble.
One tracked dataset put the shift plainly. The share of firms on a pure per-seat pricing model slid from 21% to 15% in twelve months. Over the same stretch, hybrid plans jumped from 27% to 41%.
Buyers drove that change. They started negotiating hard on empty seats during the 2022 to 2024 belt-tightening. Then AI-native tools arrived with costs that a flat seat fee simply cannot capture.
How the Pricing Model Mix Breaks Down Now
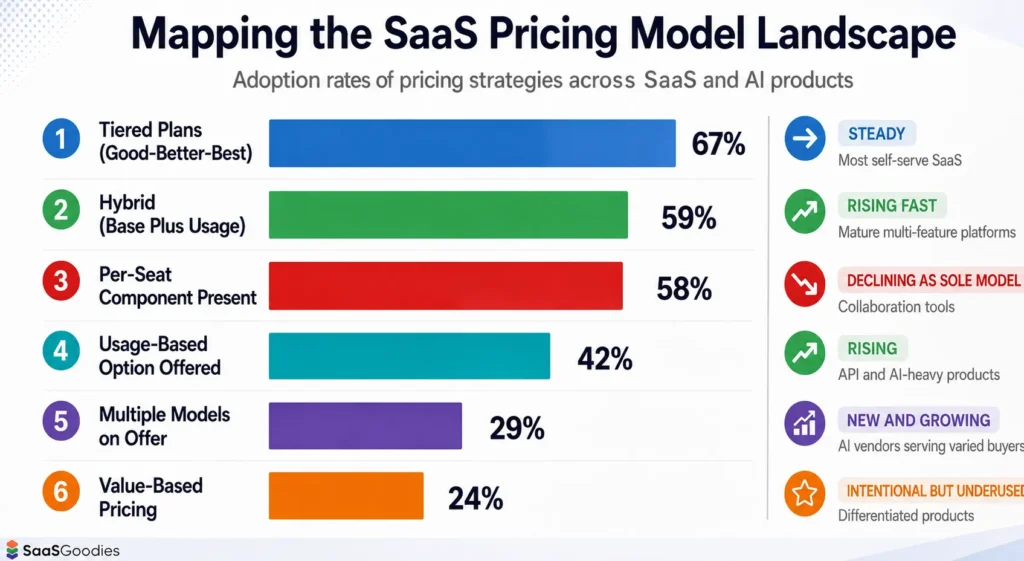
Read the model split as a spread, not a single winner. Here is where the numbers land in 2026:
| Pricing model | 2026 adoption | Direction | Best fit |
|---|---|---|---|
| Tiered plans (good-better-best) | 67% | Steady | Most self-serve SaaS |
| Per-seat component present | 58% | Declining as sole model | Collaboration tools |
| Hybrid (base plus usage) | 59% | Rising fast | Mature multi-feature platforms |
| Usage-based option offered | 42% | Rising | API and AI-heavy products |
| Value-based pricing | 24% intentional | Underused | Differentiated products |
| Multiple models on offer | 29% | New and growing | AI vendors serving varied buyers |
Gartner expects most businesses to favour usage over seats this year. Analysts at IDC think 70% of vendors move off pure per-seat by 2028. Both point the same way.
Where we land: hybrid wins the transition, not pure usage. Buyers hate surprise bills, and finance teams want a floor they can budget. A base fee plus a metered layer gives both sides what they want, so we expect hybrid to pass 65% adoption inside 2026.
How AI Rewrote the Pricing Question in 2026
Here is the shift we did not see coming this fast. AI agents changed what a “unit” even means.
Old logic charged per person with access. New logic charges per job done. When an agent resolves a ticket or books a meeting, the natural unit becomes the result, not the head count.
Spending proves the appetite. Money flowing into AI-native apps jumped 108% year on year. Gartner reckons 40% of enterprise apps carry an AI agent by the close of 2026, up from under 5% a year earlier.
That gave rise to the outcome-based pricing model, where you only pay when the software actually delivers. A few live examples that shaped the year:
There is a catch, and it is a big one. Consumption bills scare finance teams. About 78% of IT leaders reported charges they did not expect from consumption or AI features. Nine in ten CIOs name cost forecasting as their top worry.
Money aside, the maths under the hood changed too. Classic SaaS carried near-zero cost to serve one more user. AI does not. Every answer burns real compute, so each request carries a live marginal cost.
That breaks flat seat pricing. Sell a seat for a fixed fee, let one power user hammer the model all day, and gross margin quietly bleeds out. Software margins used to sit at a healthy 70% to 90%. AI features drag that floor down unless the price tracks usage.
Model costs are falling fast, which helps. Token prices dropped sharply over the past year, so vendors can afford to fold more allowance into each plan. The winners meter the heavy users and stay generous with the light ones.
| AI pricing approach | How it charges | Real example | Buyer risk |
|---|---|---|---|
| Usage or token based | Per API call, action, or token | Most AI infrastructure tools | Spiky, hard to forecast |
| Outcome based | Per completed result | Intercom Fin, $0.99 per resolution | Defining a valid outcome |
| Hybrid credit model | Base fee plus credit pool | Salesforce Agentforce | Credit maths gets murky |
| Embedded AI add-on | Flat surcharge on a seat | Productivity suites | Paying for unused capacity |
Straight from our desk: outcome pricing sounds perfect and sells terribly without guardrails. The vendors winning here pair a metered model with spend caps, live usage dashboards, and clear alerts. Skip those, and one shock invoice ends the account for good. We expect spend controls to become a standard line on every AI pricing page this year.
What Buyers will Actually Pay in 2026
Price tolerance is not one number. It bends with deal size and how painful switching would be.
Small buyers feel every pound. A card-swipe customer on a cheap plan bolts the moment a rival looks better value. Their switching cost is basically zero, so their patience with a rise is thin.
Enterprise buyers behave the opposite way. Once a tool wires into their workflows and data, ripping it out costs more than the price rise. That lock-in is exactly why vendors chase larger accounts.
The pricing power gap shows up in the numbers we watch:
That private judgement is the quiet risk. A buyer compares three tools in an afternoon, and a fuzzy price loses before a call ever happens.
Field note: the 5% rule still holds. Raise price about 5% a year until roughly one in five customers pushes back. If nobody complains, you priced too low and left money behind. A little friction at renewal is the sign you found the ceiling, not a reason to panic.
Free Trial vs Freemium: The Conversion Numbers Read Wrong
Now to the number founders quote most and understand least. The famous 8% average is close to useless on its own.
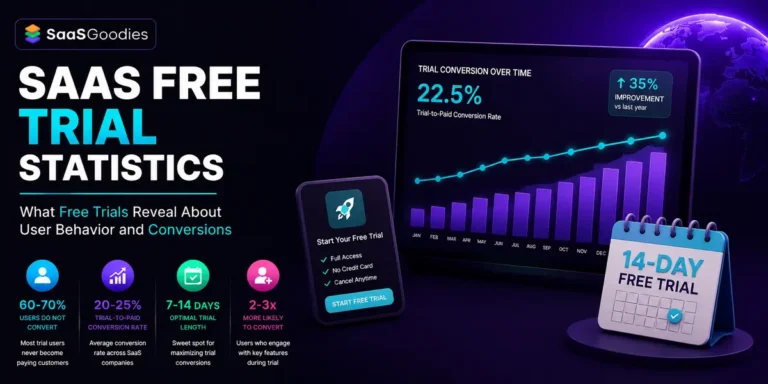
The median free-to-paid conversion rate across 200 B2B products sits near 8%. But that hides a split. Around 20% of trial products convert under 2.5%, while roughly a quarter clear 25%. Almost nobody actually sits at the average.
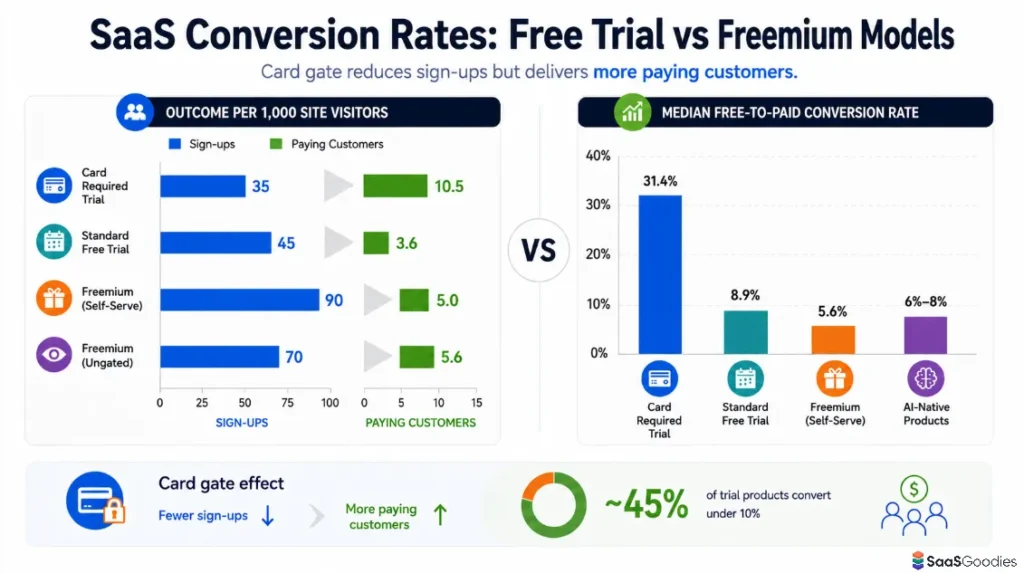
Model choice moves the number hard. Asking for a card upfront lifts the rate, yet cuts total sign-ups. Here is the clean version by model:
Raw rates mislead, though. You have to count the full funnel. Per 1,000 site visitors, the picture flips:
So the label matters less than the gate. Requiring a card thins the crowd but fattens the paying end.
| Model | Median conversion | Good rate | Great rate |
|---|---|---|---|
| Card-required trial (opt-out) | 31.4% | 25% to 35% | 50%+ |
| Opt-in trial (no card) | 8.9% | 4% to 6% | 10% to 15% |
| Freemium self-serve | 5.6% | 3% to 5% | 8% to 12% |
| AI-native products | 6% to 8% | 6% to 8% | 15% to 20% |
Our read: stop chasing a single benchmark. Pick your gate on purpose. A viral, low-price tool lives on freemium volume. A considered purchase over $50 a month usually earns more from a card-required trial. The biggest wins land before the trial ends anyway, when a user hits a real “aha” in the first three days.
Show the Price or Lose the Buyer: Pricing Page Data
Pricing pages turned into a genuine conversion lever this year. Buyers self-qualify long before any sales call.
The transparency split is roughly even. About 45% of firms publish real prices. The other 55% hide behind “contact sales.” A large slice of the market still shows no number at all.
Hiding the price is tempting because it lifts form fills. One study of 31 million visitors found opaque pages pulled 64% more submissions. But those leads converted to real pipeline at 1.7 times worse. Volume up, quality down.
SaaS pricing page transparency matters more now because AI answers read your page. Ask an assistant to compare three tools, and any vendor with pricing locked in a PDF gets skipped in the table.
What Actually Lifts Pricing Page Conversion
Structure beats decoration. A few patterns hold up across the data:
Buyers also want to serve themselves. Around 61% prefer a rep-free purchase. A missing price fights that instinct directly.
| Pricing page factor | 2026 benchmark | Why it matters |
|---|---|---|
| Firms publishing prices | 45% | Rest gate behind contact sales |
| Transparent-page pipeline conversion | 17.5% | vs 10.3% for hidden pricing |
| Optimal tier count | 3 to 4 | Prevents decision paralysis |
| Mobile share of page traffic | 58% | Stacked layout beats tables |
| Buyers wanting rep-free buying | 61% | Published price serves them |
| Lift from tier simplification | up to 158% | Fewer choices, more sign-ups |
What we reckon: if your average contract value sits under $25,000, publish the price. Full stop. Buyers below that line already decided not to call a rep. Reserve “contact sales” for genuine six-figure custom deals, and always give a starting anchor even there.
Price Rises and Discounting: How Much, How Often
Pricing power came back with force. The growth-at-all-costs era of near-free plans is over.
Annual list increases now run 8% to 12% on average. Aggressive movers push 15% to 25%. Add hidden migration fees and credit multipliers, and the real increase often reaches 20% to 30%.
The safe cadence most operators use is simple. Raise price by roughly 5% each year until about 20% of customers push back. That pushback is the signal you found the ceiling.
Pairing a rise with real value pays off. Value-added increases post 26% higher gross retention than bare hikes. Migration handled well keeps churn low, which is why grandfathering runs 12 to 24 month grace windows.
Why smart teams discount less now
Discounting fell out of fashion for good reasons. Around 68% of firms discount on fewer than a quarter of deals. Nearly 29% barely discount at all.
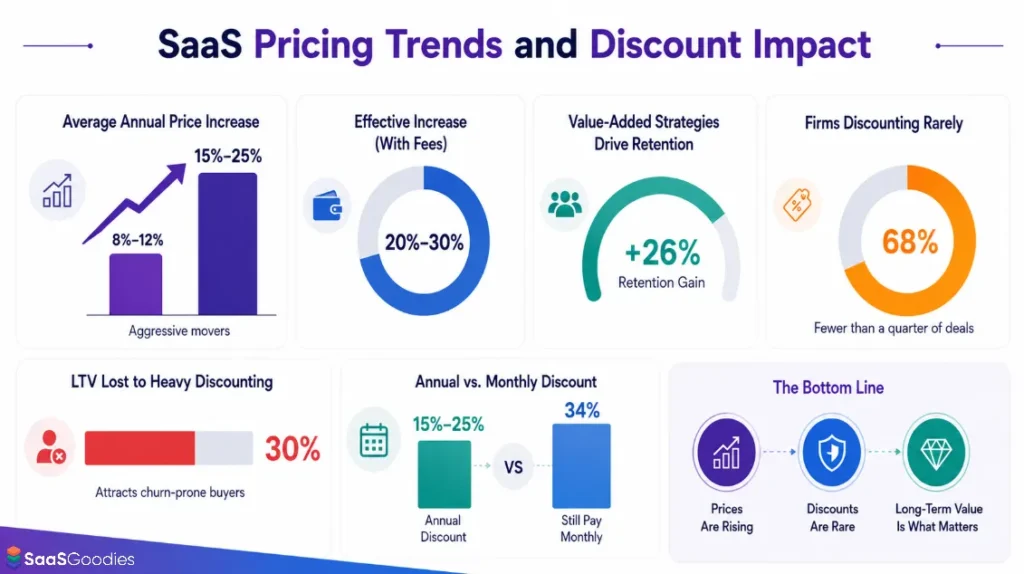
The maths explains it. Heavy discounting cuts lifetime value by about 30% on average and drags in price-sensitive buyers who churn faster. Extended trials or added support beat a price cut almost every time.
Billing choice is quiet money too. Annual plans carry a 15% to 25% discount versus monthly. Yet around 34% of customers still pay monthly, leaving 8% to 12% of savings on the table.
| Price and discount metric (2026) | Figure | Note |
|---|---|---|
| Average annual price increase | 8% to 12% | Aggressive movers hit 15% to 25% |
| Effective increase with fees | 20% to 30% | Migration and credit multipliers |
| Value-added increase retention gain | +26% | Higher gross retention |
| Firms discounting rarely | 68% | Fewer than a quarter of deals |
| LTV lost to heavy discounting | 30% | Attracts churn-prone buyers |
| Annual vs monthly discount | 15% to 25% | 34% still pay monthly |
From where we sit: treat a price rise as a product launch, not an email. Ship a new feature alongside it, tell the value story clearly, and grandfather your loyal base for a year. Do that and a double-digit increase lands as fair rather than greedy. Skip it, and you turn a rise into a churn event.
Renewals are Where the Real Money Hides
New logos grab the headlines. Renewals pay the bills. That gap gets bigger every year.
Renewals now account for a striking 87% of all software spend across organisations. New purchases are the small slice on top. So the price you set at renewal matters far more than the one on your sign-up page.
Volatility is the fresh problem. Stable contracts keep producing unstable bills, mostly from usage and AI add-ons. Around 77% of IT leaders got hit by costs that only surfaced after signing.
Vendors treat renewal as their main lever now, and buyers feel it. A quiet 10% step-up on 300 apps compounds into a serious budget shock. Finance teams push back harder each cycle as a result.
Two moves keep renewals healthy on both sides of the table:
Bottom line: a renewal is a second sale, not an auto-charge. Show the value the customer got last year, name the new features shipping next year, then present the number. Vendors who do that keep the account. Vendors who let the invoice do the talking train customers to shop around.
Pricing psychology that still earns its keep
Numbers on a page are never neutral. How you frame a price shifts what buyers choose.
A few tactics keep proving themselves in real tests, not theory:
Simplicity wins the layout battle too. Cutting a five-tier grid to three lifted one team's conversion from 1.2% to 3.1%. More whitespace alone added around 28%.
The lesson is blunt. Buyers do not read every feature row. They scan for the plan that fits and the price that feels fair, then decide in seconds.
Our honest maths: pricing psychology is not a trick, it is clarity. A confused buyer defaults to “no”. Give three clean tiers, one obvious recommendation, and a price framed around value, and you remove the friction that quietly kills self-serve sign-ups.
The Cheapest Growth Lever Most Teams Skip
Here is the gap that surprised us most in the SaaS pricing statistics we gathered. Pricing is the fastest lever nobody pulls.
Only about 24% of firms run regular pricing experiments. The ones that do grow roughly 25% faster than teams with static prices. A price change hits revenue instantly, unlike a feature that takes months to ship.
Usage models also help the retention side. Firms on a consumption-based pricing model report net revenue retention near 120%, against roughly 110% for subscription-only peers. When customers grow, the bill grows with them.
A quick checklist we hand to founders before they touch price:
Our take: a value-based pricing strategy built on real willingness-to-pay data beats copying a competitor every time. Most teams price on a hunch, then never revisit it. Set a review every six months, run one clean test, and you already sit ahead of three-quarters of the market.
How Pricing Should Change as a Company Grows
One price model rarely lasts a company's whole life. What works at ten customers breaks at ten thousand.
Early on, keep it dead simple. A flat rate or a clean per-seat plan removes friction and gets you to real usage data. Do not over-engineer a clever model before you even know your value metric.
At the growth stage, add structure. Bring in three tiers, start a usage layer where it fits, and run your first real price test. This is where most teams leave money behind by never revisiting the number.
At scale, the game turns to expansion. Big accounts grow through a base plus metered layer, and retention becomes the engine. Churn tells the story by size:
Geography adds another layer. More vendors now set regional prices tuned to local buying power, rather than charging a São Paulo buyer the same as a San Francisco one. That single move captures customers who would otherwise walk at the checkout.
Expansion revenue is the quiet winner in all of this. A usage layer means a growing customer pays more without a new negotiation, which is why net revenue retention above 110% grows a company far faster than fresh logos alone.
Straight talk: match the model to the stage, not to a blog post. Copying a scale-up's usage-based structure at seed just confuses your first buyers. Earn the right to a clever model by learning what your customers actually value first.
SaaS Pricing Statistics 2026: Quick FAQs
What is the average SaaS price increase in 2026?
List prices rise 8% to 12% a year on average. Aggressive vendors push 15% to 25%, and hidden fees can lift the real increase to 20% to 30%.
How much do companies spend on SaaS per employee?
Around $10,800 per employee per year in 2026, up from $9,643 in 2025. Tech-heavy firms sit higher, while retail and manufacturing sit lower.
Is usage-based pricing bigger than per-seat now?
Not yet, but the gap is closing fast. Per-seat components still appear in about 58% of products, while usage options reach around 42% and hybrid models near 59%.
What is a good free-to-paid conversion rate?
The median across B2B products is about 8%. Card-required trials average near 31%, opt-in trials near 9%, and freemium near 6%.
Should a SaaS company show pricing on its website?
Publish it if your average contract value sits under $25,000. Transparent pages convert to pipeline about 1.7 times better, even when they pull fewer raw leads.
How often should SaaS companies change pricing?
Review at least twice a year and run one clean test. Only about 24% of firms experiment regularly, yet those that do grow roughly 25% faster.
What is outcome-based pricing?
You pay only when the software delivers a defined result, such as a resolved support ticket. It is the newest AI pricing model, best paired with spend caps.
Our Honest read on SaaS Pricing in 2026
We have written a stack of stats posts. Here is what we would actually act on this year, in plain terms.
Pricing sits closer to the top of the growth job list than it used to. A single well-timed change moves revenue faster than a quarter of feature work. Yet most teams still touch it once and forget it for a year.
Seats are not gone, but seat-only pricing is a liability. Add a usage layer that maps to the value you deliver, and keep a base fee so finance can budget.
AI turned pricing into a strategic weapon rather than a footnote. If your product does the work, charge for the work, then wrap it in spend caps and clear dashboards.
Publish your price unless you sell genuine enterprise custom deals. Hidden pricing loses the self-serve buyer and gets you skipped inside AI comparisons.
And test more often. Pricing is the single fastest path to revenue you already own. These SaaS pricing statistics are a starting benchmark, not gospel, so tune every number against your own margins, motion, and market. The figures above are the ones we are betting on.
- OpenView Partners, SaaS Benchmarks and Pricing Survey
- Gartner, Software and Usage-Based Pricing Forecasts
- Zylo, SaaS Management Index
- ChartMogul and ProductLed, SaaS Conversion Report
- Chargebee, State of Subscriptions Report
- Bessemer Venture Partners, AI Pricing and Monetization Playbook
- Vertice, SaaS Inflation Index
- CloudNuro, Essential SaaS Statistics
- First Page Sage, Free Trial and Freemium Conversion Benchmarks
- Statista, SaaS and Software Market Data
- Monetizely, Guide to SaaS, AI and Agentic Pricing
- Growth Unhinged, State of B2B Monetization