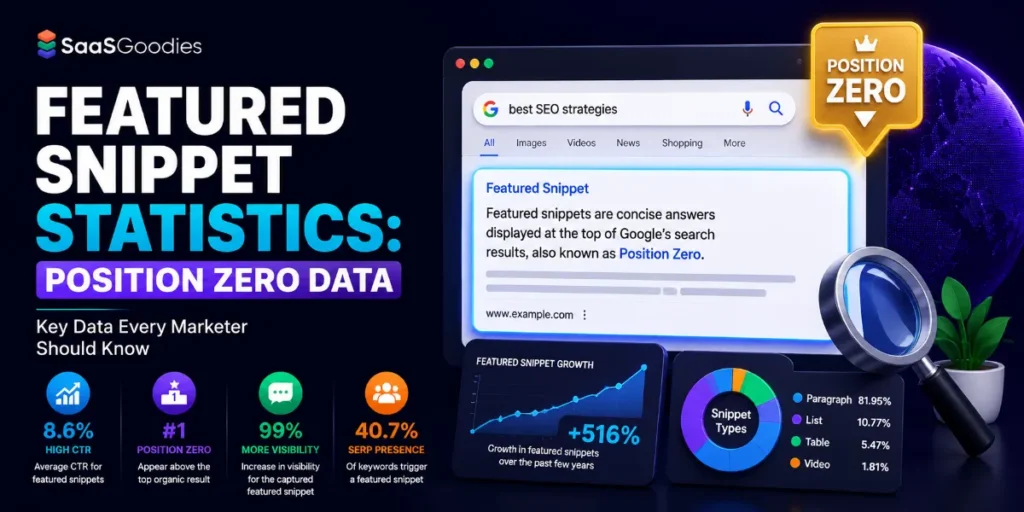
Featured Snippet Statistics 2026: Position Zero Data

Position zero pays 42.9%. Ranking first without it pays 39.8%. Same page, same query, nearly three points of click-through separating them.
Here is the twist nobody put on a conference slide. Snippet visibility crashed 64% during 2025, then clawed back to roughly 12% to 15% of desktop queries.
We have chased answer boxes across our own SaaS pages since 2023, so these Featured Snippet Statistics come from tracking what actually happened. Position zero did not die on us. Position zero simply got scarce, and scarce things get expensive.
Featured Snippet Statistics 2026 at a Glance
Skim these first, then read the sections that make you wince.
How Often Does Position Zero Actually Appear in 2026?
Here is where most stat roundups quietly mislead you. They pick one number and pretend the argument was settled years ago.
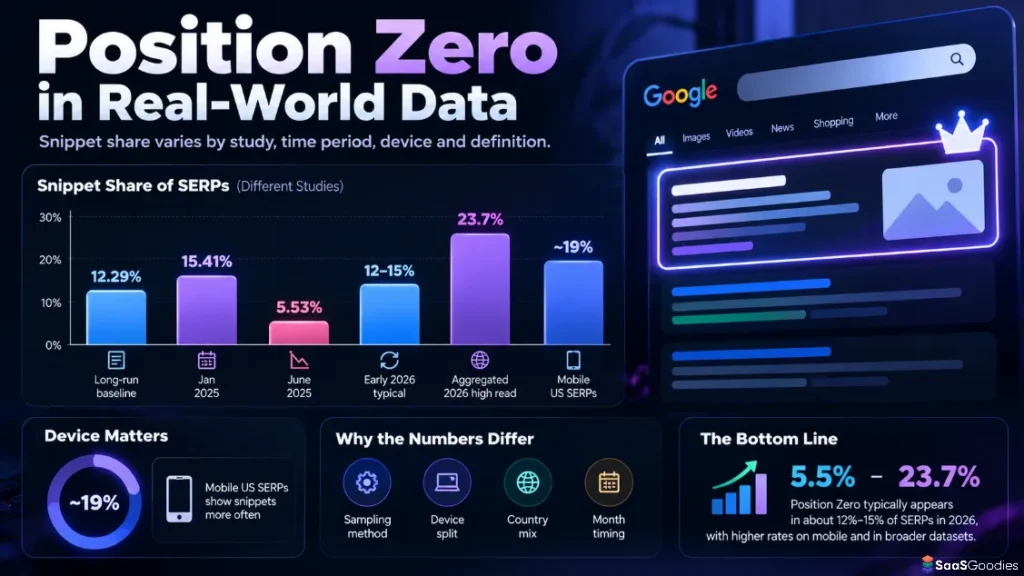
The published datasets disagree with each other, and the disagreement is the actual story. One large sample puts snippet prevalence near 12.29% of queries. Another tracker reports 23.7% after AI Overviews matured. A third measured a fall to 5.53% by mid-2025.
All three readings can be correct at once. Sampling method, device split, country mix and month all shift the figure hard.
| Measurement point | Snippet share of SERPs | Sample basis | What changed |
|---|---|---|---|
| Long-run baseline | 12.29% | 2 million snippets across 14 M US keywords | Pre-AI Overview normal |
| January 2025 | 15.41% | 1,000,000 random US desktop SERPs | Peak snippet density |
| June 2025 | 5.53% | Same desktop panel, six months later | AI Overviews absorbed informational queries |
| Early 2026 typical | 12% to 15% | Multiple desktop trackers | Partial rebound as Google rebalanced |
| Aggregated 2026 high read | 23.7% | 214 M queries, 18 countries, 24 verticals | Broader definition, mobile and voice included |
| Mobile US SERPs | About 19% | Mobile-only sample | Small screens surface answers earlier |
Our position after three years of tracking our own pages is deliberately narrow. Plan against 12% to 15% on desktop, and treat anything above 20% as a mobile or aggregated read. Both figures are useful, and confusing one with the other wrecks your forecasting.
What we watch instead of the headline figure: snippet presence across our own 200 priority queries, checked monthly. Ours sits near 16%, because SaaS how-to phrasing skews unusually snippet-friendly.
The SaaSGoodies read: stop arguing about the industry average altogether. Pull your top 100 queries, count how many show an answer box, then use that number. Yours is the only one paying your hosting bill.
Click-Through Rates: What Winning the Answer Box Really Pays
The headline number is generous. The fine print is genuinely brutal.
A featured snippet click-through rate of 42.9% in first position sounds like a jackpot. Then you learn the snippet link alone pulls just 8.6% of clicks, while the ordinary blue link sitting beneath it collects 19.6%.
Both facts hold, because they measure different objects. One measures the page owning the box. The other measures the box itself as a clickable element.
| Position on the page | Click-through rate | Read on it |
|---|---|---|
| Snippet held in position 1 | 42.9% | Best slot available on any results page |
| Plain position 1, no snippet above | 39.8% | Strong, though still beaten by the box |
| Snippet held in position 2 | 27.4% | Better than a normal second listing |
| Result sitting directly beneath a snippet | 19.6% | Free traffic for whoever holds second |
| Snippet link on its own | 8.6% | Users read the answer, then skip the link |
| First result with no snippet anywhere | About 26% | Cleaner page, fatter click share |
| Snippet plus top organic slot together | Above 50% | The only combination worth chasing |
Read that final row twice over. Owning the box alongside the first organic listing pushes combined click-through past 50%, roughly double what a lone first position earns.
Owning only the box is a weaker outcome than most SEO decks are willing to admit.
Three click-through patterns we see repeatedly across our own SaaS pages:
Our buying-desk view: treat definition boxes as brand impressions and comparison boxes as traffic. Budget the two separately. We stopped counting definition wins as traffic gains during 2025, and our forecasts became far more honest overnight.
Where Google Pulls Snippets From: The Top 10 Rule
Good news for anyone parked at position six. Snippets behave like promotions rather than lottery tickets.
99.58% of answer boxes come from pages already ranking in Google's top 10 for that query. Page two content is effectively ineligible, no matter how well it answers the question.
Only 30.9% of boxes get lifted from the number one result. The clear majority arrive from positions two through ten.
Our shortcut for building a snippet backlog: filter Search Console for queries where average position sits between 2 and 8, then sort by impressions. That list becomes your snippet queue, ranked by value, in about four minutes of work.
Snippet Formats Ranked by How Often Google Picks Them
Format is a decision rather than an accident. Google serves four types, and choosing wrong loses you the box even with stronger content.
| Snippet format | Share of all boxes | Ideal content shape | Query wording that triggers it |
|---|---|---|---|
| Paragraph | About 70% | 40 to 50 word direct answer under a matching heading | “what is”, “why does”, “meaning of” |
| List, ordered or bulleted | 19.1% | 5 to 8 items, each running 10 to 20 words | “how to”, “steps to”, “best X for Y” |
| Table | 6.3% | Real HTML table markup, three or more columns | “X vs Y”, “pricing”, “difference between” |
| Video | 4.6% | Timestamped chapters with a clear spoken answer | “how to” with a visual outcome |
Two format details quietly cost teams real money every month.
Tables need actual table markup to qualify. Google does not extract comparison data from styled divs or screenshots of spreadsheets. We lost three pricing boxes during 2024 to exactly that mistake, rebuilt the markup properly, and recovered two inside a month.
Paragraph length has a measured sweet spot. Answers running 40 to 60 words win most often. Under 40 words reads as incomplete, while anything past 60 words introduces ambiguity and Google picks a tighter competitor instead.
Which Queries Trigger a Featured Snippet, and Which Never Will
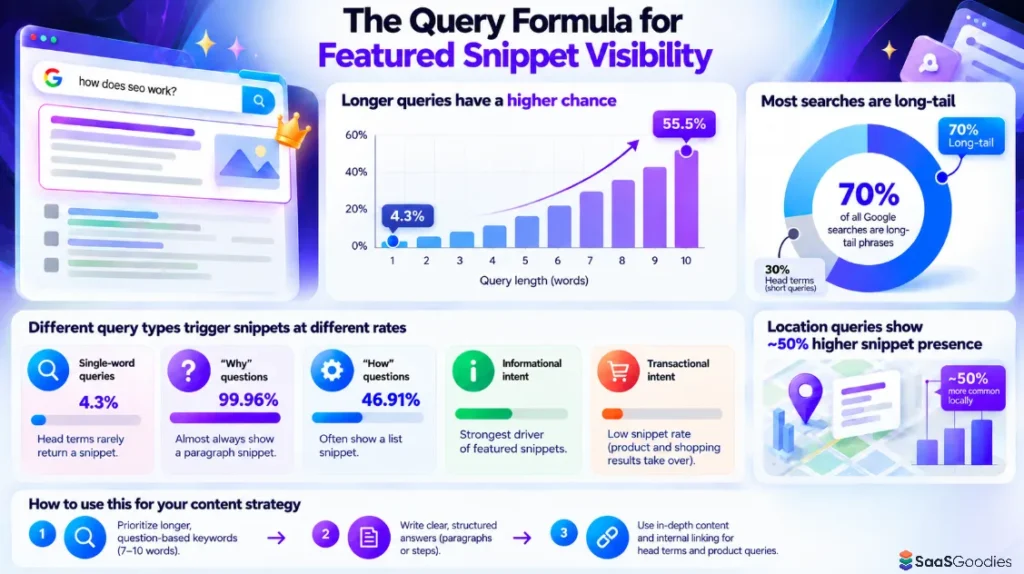
Query shape predicts snippet presence better than domain authority does. Length matters more than almost anything else.
| Query characteristic | Snippet trigger rate | Practical meaning |
|---|---|---|
| Single-word query | 4.3% | Head terms almost never return a box |
| Ten-word query | 55.5% | Full questions behave like snippet magnets |
| “Why” questions | 99.96% paragraph format | Near-certain format, so write flowing prose |
| “How” questions | 46.91% list format | Lead with clearly numbered steps |
| Informational intent | Dominant snippet driver | Also the intent AI Overviews target hardest |
| Transactional intent | Low snippet rate | Product and shopping units take over |
| Location-based queries | About 50% more common locally | Local packs and answer boxes stack together |
The pattern behind those rows is simple enough. Longer, fully-formed questions get answered directly, while one-word searches get handed a menu of options.
What we do with all of this: our keyword research now sorts by word count before search volume. A nine-word question at 200 monthly searches beats a 4,000-search head term when the goal is position zero visibility. One target is winnable, and the other realistically is not.
Around 70% of all Google searches are long-tail phrases, so the winnable pile is considerably bigger than most teams assume.
Intent phrasing deserves the same attention as length. Queries opening with “why” behave differently from queries opening with “which”, even at identical word counts.
We keep a simple sorting rule on the content calendar. Question-shaped queries get an answer block written for extraction, while head terms and product queries get written for depth and internal linking instead.
Featured Snippets vs AI Overviews: Who Owns the Answer Now
Here is the section that should change your budget. Featured snippets did not lose to AI Overviews, because snippets quietly became the feedstock.
AI Overviews render on somewhere between 25.8% and 31% of US results pages in 2026. Some trackers report far higher figures on curated commercial keyword sets, and informational queries drive almost all of that presence.
| Metric | Featured snippet | AI Overview |
|---|---|---|
| Presence on US results pages | 12% to 15% on desktop | 25.8% to 31% overall |
| Sources used per answer | One page, quoted verbatim | Several pages, synthesised |
| Click-through to the source | 8.6% for the box link | About 1% click a cited link |
| Effect on position 1 CTR | Lifts it to 42.9% | Cuts it by as much as 58% |
| Zero-click rate when present | Feeds the 58% to 68% overall rate | 83%, rising to 93% inside AI Mode |
| Best content shape | 40 to 60 word extractable answer | Same, plus supporting evidence |
| B2B tech query prevalence | Moderate | Above 80% |
Now the figure that should reshape your content plan entirely. Pages previously chosen for a featured snippet get cited inside AI Overviews at roughly twice the rate of non-snippet pages. Around 68% of AI Overviews go on to cite whichever source holds the box for that query.
Domains losing a snippet saw AI Overview citation frequency drop about 23% within 60 days. Snippet stability works as a leading indicator of AI visibility.
What the overlap means in daily practice:
Where we have landed: snippet tracking now doubles as our early-warning system for AI citation loss. When a box slips away, citations follow inside two months. Watching one without the other means flying half blind.
The Zero-Click Reality Behind Every Snippet Win
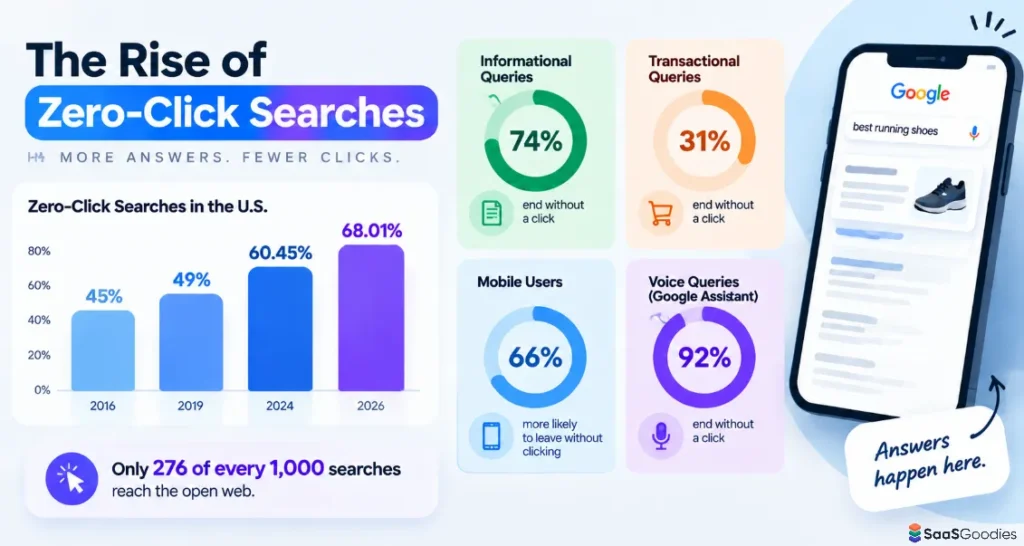
Answer boxes belong to a much larger shift. Most searches now finish on Google's own page without going anywhere else.
US zero-click searches reached 68.01% during 2026, climbing from 60.45% in 2024. Roughly 276 of every 1,000 searches now reach the open web at all.
None of those numbers make snippets pointless. Being the on-screen answer is frequently the only visibility available on a small screen.
The honest reframe goes like this. A snippet in 2026 buys attention and brand recall far more reliably than it buys sessions.
People Also Ask: The Feature Almost Nobody Optimises For
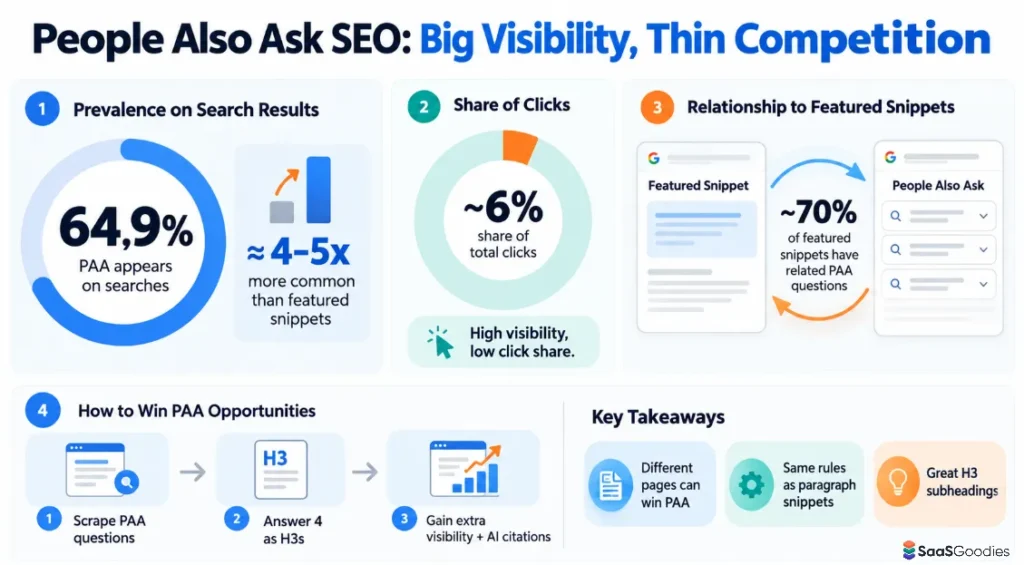
Snippets get the headlines while People Also Ask boxes get ignored, which is odd given the prevalence gap.
PAA units appear on 64.9% of searches. That makes them roughly four to five times more common than featured snippets on desktop, yet they collect only about 6% of total clicks.
Low click share explains the neglect. It also explains the opportunity, because competition for those slots stays thin.
Our approach: scrape the PAA questions for every priority query, then answer four of them as short H3 sections inside the same page. Cheap incremental visibility, and it feeds AI citation at the same time.
Featured Snippets by Industry: Where SaaS Actually Sits
Prevalence varies wildly by vertical. Your category sets a ceiling before you write a single word.
| Industry | Snippet or answer-box prevalence | AI Overview prevalence | What it means for content |
|---|---|---|---|
| Computer and electronics | 62% of queries | High | Answer-rich category, format discipline matters |
| Travel | 62% of queries | Moderate | Lists and tables dominate the boxes |
| Arts and entertainment | 59% of queries | Moderate | Paragraph boxes lead comfortably |
| Science | 54% of queries | Highest tracked | Snippet displacement most advanced here |
| Healthcare | Moderate | 88% | Boxes largely replaced by generated answers |
| Education | Moderate | Above 80% | Same pattern, informational queries absorbed |
| B2B tech and SaaS | Moderate | Above 80% | Snippet work doubles as citation work |
| Shopping and retail | Low | 13% to 14% | Product results outrank answer boxes |
SaaS sits in an awkward middle position. Software queries are question-shaped enough to trigger boxes, yet informational enough that AI Overviews grab plenty of them first.
Our own snippet numbers across SaaSGoodies pages:
Mid-funnel SaaS queries also show the strongest snippet-driven click premium of any category we have measured, sitting around 16% above an equivalent plain listing.
How Long Do You Actually Keep the Box?
Winning a snippet is one problem. Keeping hold of it is an entirely separate one.
Volatility research on snippet-holding keywords found roughly 68% showed no movement across a tracking window, leaving about 32% shifting. Of those shifts, 62% came from a URL change rather than the box disappearing.
Only around 8% vanished and never returned. Separately, 28% of snippet-holding keywords changed their snippet content inside any given four-month period.
Our maintenance rule: every page holding a box gets its answer block reviewed twice yearly, with dates and figures refreshed. Cheap insurance against a slow loss you would otherwise never see coming.
Voice Search and the Answer Box Nobody Sees
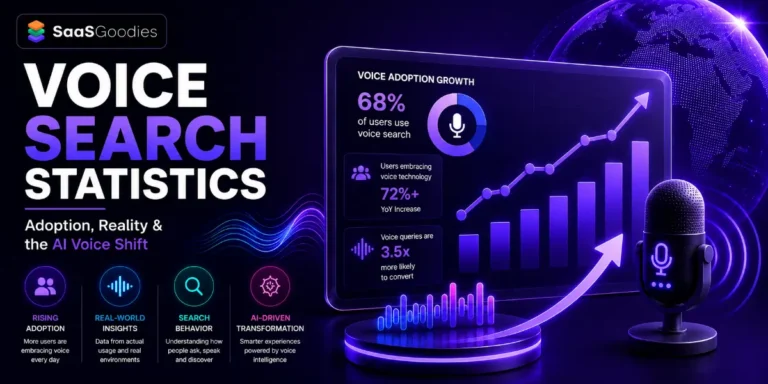
Voice interfaces make snippets literal. The box stops being a visual element and becomes the spoken response instead.
Roughly 41.2% of voice-assistant queries return a featured snippet as the primary answer. Separately, about 40.7% of voice answers get pulled straight from a snippet position.
Voice rewards one page rather than ten. No second place exists when a speaker reads a single result aloud to somebody.
Assistant usage keeps spreading across phones, cars, televisions and now AI chat apps. Each of those surfaces reads one answer, which concentrates the reward further.
Three surfaces, one piece of writing. That efficiency is the strongest practical argument for snippet work in 2026.
Desktop or Mobile: How Screen Size Changes Snippet Economics
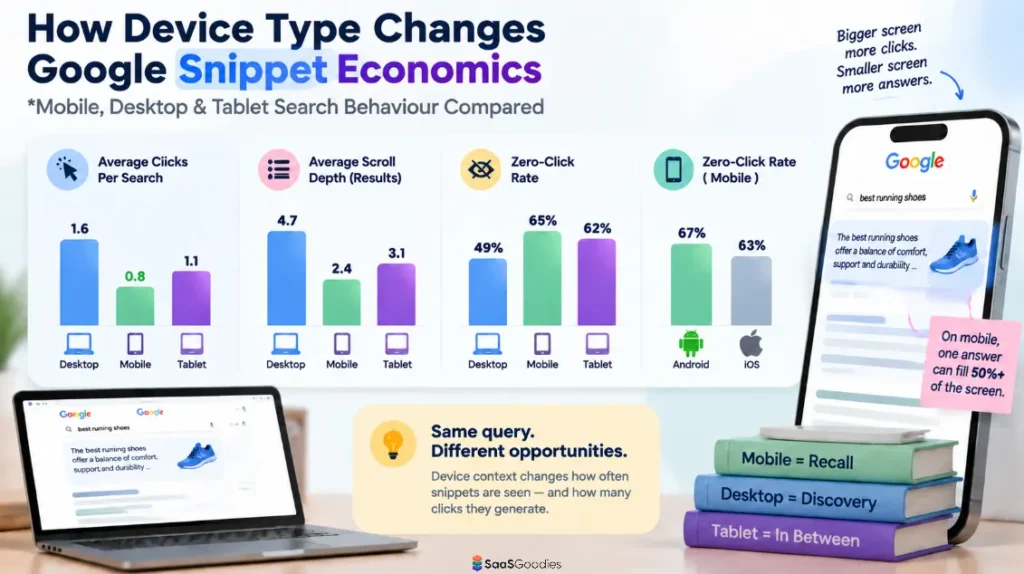
Device split changes the value of a box more than most teams account for in planning.
Mobile now accounts for over 60% of Google queries. On mobile, a single answer box can fill more than half the visible screen before anyone scrolls.
That dominance produces a strange trade. Mobile boxes get read far more often, yet they send proportionally fewer clicks onward.
Mobile boxes get written for recall, with the brand name inside the extractable sentence wherever it reads naturally. Desktop boxes get written to tease the next detail, because desktop users still scroll and still click.
What a Featured Snippet Is Worth to a SaaS Funnel
Now the money question. We run affiliate and SaaS funnels daily, so what follows is our own modelling rather than borrowed theory.
Take a query at 2,000 monthly searches with a snippet present. Holding position one without the box earns roughly 39.8% click-through, producing about 796 sessions.
Winning the box lifts that to 42.9%, or about 858 sessions. Call it a gain of 62 sessions monthly.
Modest on paper, certainly. Then the compounding quietly begins.
Across a 40-page SaaS content set, a disciplined snippet programme moves total organic sessions by 8% to 14% within two quarters. Citation frequency moves considerably further, and that is where the real return hides.
FAQs About Featured Snippet
How often do featured snippets appear in 2026?
Roughly 12% to 15% of US desktop queries return a featured snippet, against a long-run baseline near 12.29%. Mobile samples read higher, closer to 19%. Presence dropped 64% across the first half of 2025 as AI Overviews expanded, then partially recovered.
What click-through rate does a featured snippet get?
A snippet held in first position earns about 42.9%, compared with 39.8% for a plain first-position result. A second-position box earns 27.4% instead. The snippet link alone captures only 8.6%, so owning the adjacent organic slot matters just as much.
Do you need to rank first to win a featured snippet?
No, though page one is essential. Around 99.58% of boxes come from top-10 pages, while only 30.9% come from the number one result. Pages ranking between positions two and eight win fastest, often inside two to eight weeks.
How long should a featured snippet answer be?
Between 40 and 60 words for paragraph boxes, with 40 to 50 words winning most often. List boxes work best at 5 to 8 items of 10 to 20 words each. Place the answer immediately beneath a heading phrased as the question.
Did AI Overviews kill featured snippets?
No. Pages holding boxes get cited inside AI Overviews at roughly twice the rate of other pages. About 68% of AI Overviews cite the snippet holder for that query. Snippet work now feeds both surfaces, making it more valuable than before rather than less.
Are featured snippets still worth chasing for SaaS?
Yes, though with adjusted expectations. Definition boxes mostly buy brand visibility rather than sessions. Comparison, pricing and how-to boxes still send meaningful traffic. B2B software queries also carry above 80% AI Overview prevalence, so snippet work doubles as citation insurance.
Which snippet format should you target first?
Paragraph, because it accounts for around 70% of all boxes. Then check your query wording carefully. “Why” questions return paragraph boxes on 99.96% of occasions, while “how” questions return lists on 46.91% of occasions.
Our Projections for Featured Snippets Beyond 2026
Here is where we put our own neck out. These calls are built on the figures above plus what we watch weekly.
None of that counts as fortune telling. It is where the 2026 data already points, pushed forward by one step.
- Ahrefs | Featured Snippets Study of 2 Million Snippets
- Ahrefs | How SERP Features Have Evolved in the AI Era
- Ahrefs | AI Overviews Reduce Clicks Update
- First Page Sage | Google Click-Through Rates by Ranking Position
- Semrush | Zero-Click Searches Study
- Pew Research Center | Google Users Are Less Likely to Click When an AI Summary Appears
- Search Engine Land | Google Zero-Click Searches Reach 68%
- Similarweb | Zero-Click Marketing and What the Data Means
- StatCounter | Global Search Engine and Platform Market Share
- SERPs.io | AI Overview Prevalence by Industry Benchmarks
- Searchlab | Zero-Click Search Statistics
- Keywords Everywhere | Are Featured Snippets Still a Thing