Semrush Statistics 2026: Revenue, Users and Growth Trends

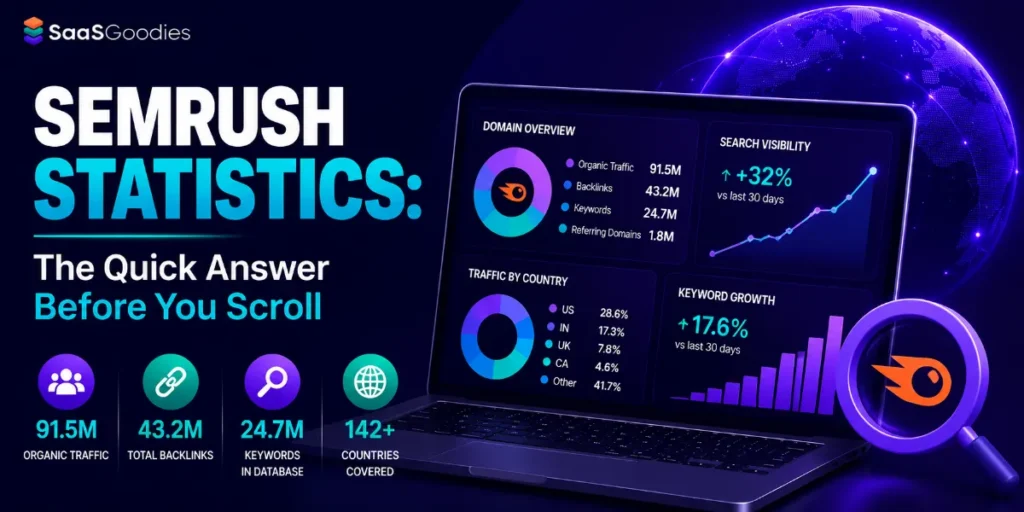
Semrush closed 2025 on $443.6 million in revenue and $471.4 million in annual recurring revenue. Paying customers sit near 117,000. AI products jumped from $4 million to $38 million in ARR inside twelve months. Adobe then bought the whole company for $1.9 billion.
We have tracked this platform since our first affiliate payout in 2023, and the shape of its growth has changed completely. Rankings used to pay the bills, and now AI visibility does. These Semrush Statistics 2026 show exactly where the money moved, and what it means for your stack.
Every figure below comes from company filings, product pages and our own directory data. Where two credible numbers disagree, we say so instead of quietly picking the prettier one.
Semrush Key Numbers At A Glance
| Metric | Latest figure | Prior year | Change | What we read into it |
|---|---|---|---|---|
| Full-year revenue | $443.6 million (2025) | $376.8 million (2024) | Up 18% | Growth held above the SaaS median |
| Annual recurring revenue | $471.4 million (end 2025) | $411.6 million (end 2024) | Up 15% | ARR now runs ahead of booked revenue |
| Paying customers | About 117,000 | About 106,000 | Up roughly 10% | Seat expansion beats seat count |
| Free and total active users | 1.04 million free, 1.17 million active | 1.09 million active | Up 7% | Free tier still feeds the funnel |
| Customers paying $10,000+ a year | About 5,800 | 4,426 | Up 31% | Mid-market is the growth engine |
| Customers paying $50,000+ a year | About 500 | 291 | Up 74% | Enterprise land grab is working |
| AI product ARR | $38 million | $4 million | Up 850% | Fastest product ramp in company history |
| Enterprise platform ARR | $37 million across 579 accounts | $9 million | Up 311% | Average enterprise deal near $64,000 |
| Dollar-based net revenue retention | 104% | 106% | Down 2 points | Churn pressure sits at the small end |
| Cash flow from operations | $59.6 million (13.4% margin) | $50.1 million | Up 19% | Self-funding, no raise needed |
| Adjusted operating income | $53.3 million (12% margin) | $45.8 million | Up 16% | Profitable on an adjusted basis |
| Acquisition value | $1.9 billion, $12.00 a share | Public since 2021 | Closed in 2026 | Adobe owns the category leader now |
Revenue Growth History: How Semrush Reached $443.6 Million
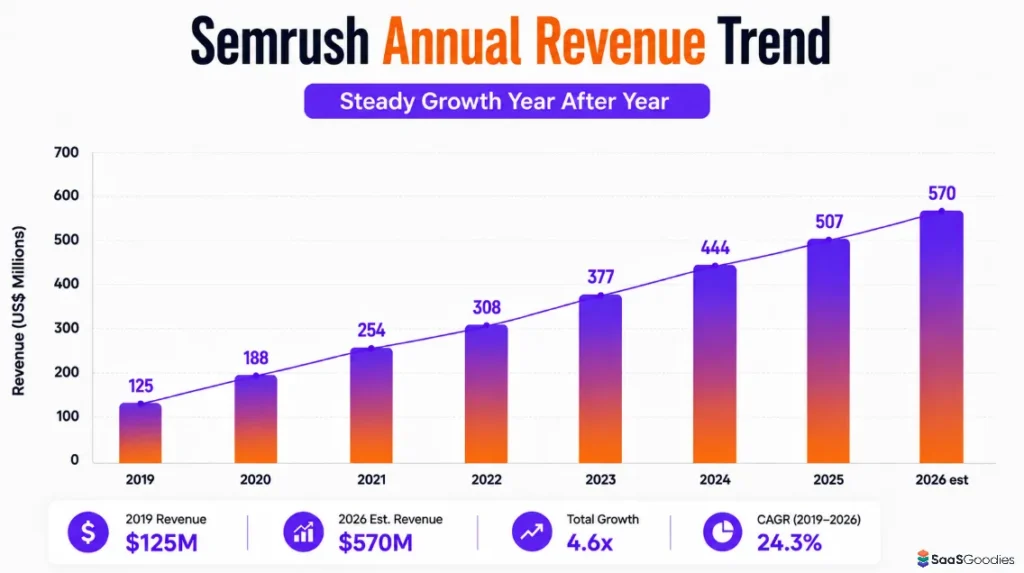
Revenue growth here has been very steady for a marketing platform. No hockey stick, and no collapse either. Just eight straight years of compounding.
Full-year 2025 landed at $443.6 million, an 18% rise on the $376.8 million booked a year earlier. Back in 2019 the company turned over $92.1 million, so revenue has grown almost fivefold in six years.
What makes that run interesting is the revenue mix. Subscriptions carry nearly all of it, with almost no services and almost no one-off fees. Pure recurring software revenue, which is why annual recurring revenue growth tells you more than the reported top line.
| Year | Revenue | Year-on-year growth | End-of-year ARR | ARR growth | Net new ARR added |
|---|---|---|---|---|---|
| 2019 | $92.1 million | Not disclosed | $102.6 million | Not disclosed | Not disclosed |
| 2020 | $124.9 million | Up 36% | $144.2 million | Up 41% | $41.6 million |
| 2021 | $188.0 million | Up 51% | $215.7 million | Up 50% | $71.5 million |
| 2022 | $254.3 million | Up 35% | $275.1 million | Up 28% | $59.4 million |
| 2023 | $307.7 million | Up 21% | $337.1 million | Up 23% | $62.0 million |
| 2024 | $376.8 million | Up 22% | $411.6 million | Up 22% | $74.5 million |
| 2025 | $443.6 million | Up 18% | $471.4 million | Up 15% | $59.8 million |
| 2026 (our estimate) | $500m to $515m | Up 13% to 16% | $535m to $550m | Up 14% to 17% | $64m to $79m |
Semrush revenue and ARR by year, with our own 2026 modelling in the final row.
Why Growth Slowed From 51% To 18% In Five Years
The deceleration in that chart is the part most statistics posts skip over. Growth fell from 51% in 2021 to 18% in 2025, which looks alarming until you unpack the reasons behind it.
Three things happened at once. The pandemic-era rush into digital marketing tools settled down. Cheaper competitors arrived at the $44 to $99 price band. The addressable pool of self-serve SEO buyers also began filling up.
None of that is unusual for a platform crossing $400 million in revenue. What is unusual is holding cash generation positive throughout the slowdown, which Semrush managed every single year.
Net new ARR added tells the cleaner story. The company added $74.5 million of fresh recurring revenue in 2024 and $59.8 million in 2025. So the absolute dollars slipped even as the base grew larger.
Our estimate: we model 2026 revenue at $500 million to $515 million, with a base case of $507 million. We reach that by carrying exit ARR of $471.4 million forward at 14% net new growth. Then we discount slightly for integration noise following the Adobe close.
Paying Customers And Free Users: The Real Funnel Split
Semrush reports roughly 117,000 paying customers alongside about 1.04 million free accounts. Total active users sit near 1.17 million, and more than 10 million people have opened an account at some point since 2008.
Run the maths and the free to paid conversion rate looks thin at around 10%. In practice that ratio is healthy for a self-serve SEO platform. Most free users are students, one-off researchers, or people checking a single domain.
Customer growth has now slowed to roughly 10% a year while ARR grows at 15%. So expansion income carries more weight than new logo acquisition, which is a meaningful shift from the position two years ago.
Operator flag: if you sell Semrush as an affiliate, stop chasing free signups. Our SEO tools vertical averages $64 EPC precisely because the paid tiers are expensive and sticky. One Guru conversion is worth roughly fifty trial clicks.
What Semrush Customers Actually Pay Each Year
Average revenue per customer is the metric most statistics posts get wrong, so we calculated it ourselves rather than repeating a figure we could not reproduce.
Divide exit ARR of $471.4 million by roughly 117,000 paying customers and you land near $4,030 a year. That works out around $336 a month per account, which is well above the list price of the entry tier.
Published figures vary widely on this one. Some put the number at $4,369, others at $3,125, and the gap comes from different customer counts paired with different ARR snapshots. We treat $4,000 to $4,100 as the defensible range for 2025 and flag the disagreement rather than hiding it.
The direction of travel is clearer than the exact figure. Here is how average revenue per paying customer has moved across the last six years, using our own calculations from published ARR and customer counts.
Two forces push that number upward, and neither one requires a single extra customer. Price rises do part of the work, and add-on attachment does the rest.
Enterprise Accounts Now Carry The Growth
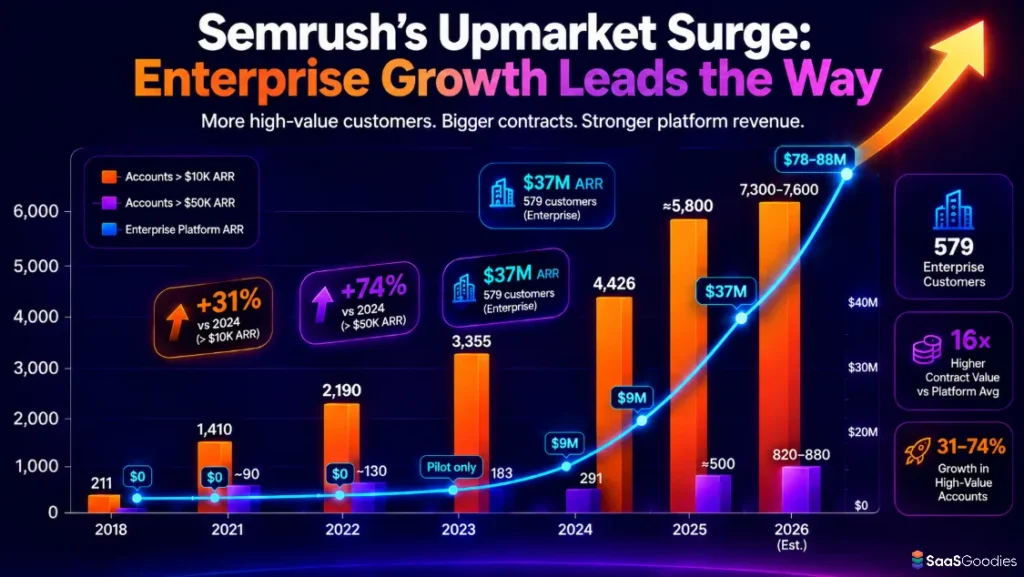
The most striking shift across these numbers is the movement upmarket. Semrush used to be a freelancer tool with an agency habit, and that description no longer fits the revenue base.
Accounts paying more than $10,000 a year reached roughly 5,800, up 31%. Accounts paying more than $50,000 a year hit about 500, up 74%, having grown from just 183 accounts two years earlier.
The dedicated enterprise product finished 2025 with $37 million in ARR across 579 customers. Average contract value there sits near $64,000, which is roughly sixteen times the platform average.
| Year | Accounts above $10,000 ARR | Growth | Accounts above $50,000 ARR | Growth | Enterprise platform ARR |
|---|---|---|---|---|---|
| 2018 | 211 | Baseline | Not reported | Not reported | Not launched |
| 2021 | 1,410 | Up 68% | About 90 | Not reported | Not launched |
| 2022 | 2,190 | Up 55% | About 130 | Up 44% | Not launched |
| 2023 | 3,355 | Up 53% | 183 | Up 41% | Pilot only |
| 2024 | 4,426 | Up 32% | 291 | Up 59% | $9 million |
| 2025 | About 5,800 | Up 31% | About 500 | Up 74% | $37 million, 579 accounts |
| 2026 (our estimate) | 7,300 to 7,600 | Up 26% to 31% | 820 to 880 | Up 64% to 76% | $78m to $88m |
Enterprise account growth by ARR band, with our 2026 projection in the closing row.
Look closely at the pattern in that table. Small accounts grow slowly while large accounts grow fast, and that combination is exactly what keeps total ARR expanding while logo growth cools off.
Enterprise SEO platform adoption is also what changed the buyer profile. Two years ago the typical decision maker was a marketing manager with a card. Now it is often a procurement team running a formal review.
What we would bet on: accounts above $50,000 pass 850 during 2026. Under Adobe ownership those deals get bundled into existing enterprise contracts, which shortens sales cycles much.
AI Products Went From $4 Million To $38 Million In ARR
This is the number we keep repeating to clients. AI product ARR grew from $4 million to $38 million inside a single year, making it the fastest product ramp the company has ever posted.
Add the enterprise platform and you get $63 million of the $471.4 million exit ARR. So AI and enterprise together now account for 13.4% of all recurring revenue, against effectively zero two years earlier.
That pace of mix change is rare in mature software businesses. Most platforms bolt AI onto existing plans and see no revenue line at all. Here, AI product ARR growth arrived as separately priced modules customers actively chose to buy.
AI And Enterprise ARR Contribution, Charted
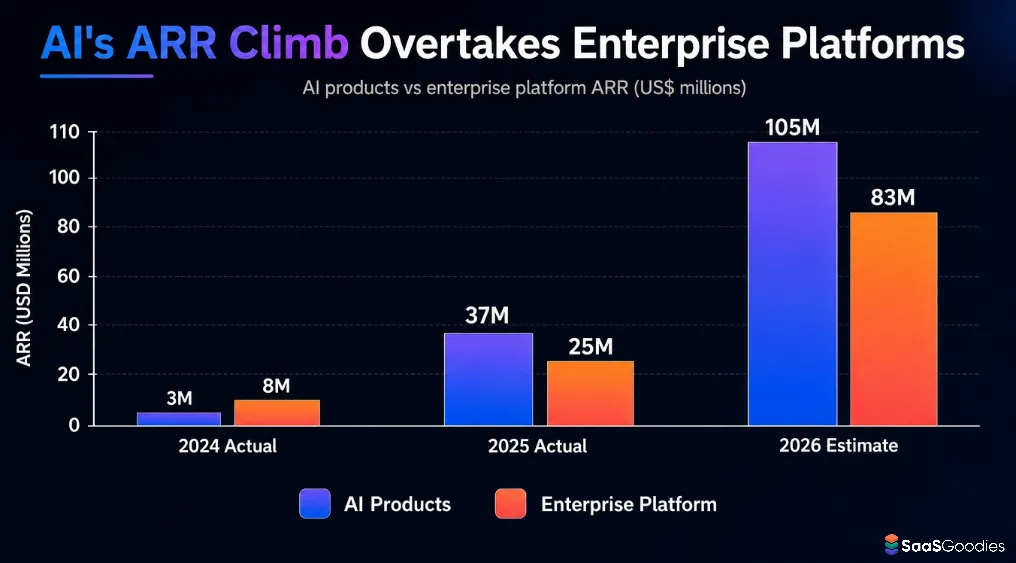
SaaSGoodies read: we put AI product ARR at $95 million to $115 million by the end of 2026, with $105 million as our base case. The $99 monthly AI visibility add-on is the lever here. Attach it to just 9% of the paying base and the line clears $100 million on its own.
Adobe Paid $1.9 Billion: The Deal Numbers That Matter
Adobe agreed to buy Semrush in an all-cash deal worth roughly $1.9 billion, at $12.00 per share, and the transaction completed during 2026.
Context makes that price interesting. Semrush shares traded at $6.76 before the news broke, then climbed around 70% on the announcement. Market capitalisation had been sitting a little above $1 billion, which is very low for a business with $471 million of recurring revenue.
So Adobe paid roughly 4 times exit ARR and about 4.3 times trailing revenue. For a company growing 15% with positive cash generation, that multiple looks modest. Comparable software deals in 2021 regularly cleared 8 to 12 times ARR.
The deal terms worth noting for anyone modelling the business:
The logic behind the deal is simple enough. Adobe already owned content creation and performance measurement. What it lacked was search visibility. Building that dataset from scratch was never realistic, given how fast AI-driven search moved through 2025 and 2026.
Editor's caution: acquisitions of this shape usually slow the small-team roadmap. We expect enterprise features to ship faster and self-serve features to ship slower. Watch renewal pricing on Pro and Guru carefully through 2027.
Semrush Pricing In 2026: Plans, Seats And Hidden Add-Ons
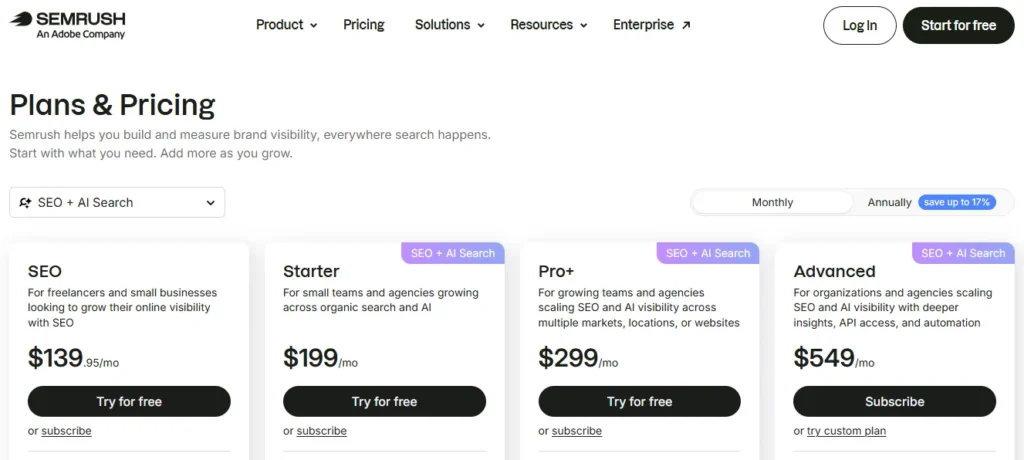
Pricing is where most buyers get caught out. List prices look clean on the website, and real invoices rarely match them.
Three classic plans remain in place. Pro costs $139.95 a month, Guru $249.95, and Business $499.95. Annual billing cuts roughly 17%, which brings Pro to $117.33 and Guru to $208.33 monthly.
A newer bundle called Semrush One starts at $199 and layers AI visibility tracking on top of the standard SEO toolkit. Every plan ships with a single user seat, and that detail is the one people miss when budgeting.
| Plan or add-on | Monthly price | Annual equivalent | Key limits | Extra seat cost | Best suited to |
|---|---|---|---|---|---|
| Pro | $139.95 | $117.33 | 5 projects, 500 keywords, 100,000 pages crawled | $45 | Solo affiliates and freelancers |
| Guru | $249.95 | $208.33 | 15 projects, 1,500 keywords, 300,000 pages, historical data | $80 | Content teams and small agencies |
| Business | $499.95 | $416.66 | 40 projects, 5,000 keywords, API access, share of voice | $100 | Agencies with five or more retained clients |
| Semrush One Starter | $199 | Not published | 50 tracked prompts, 500 keywords, 140+ countries, 17 languages | Varies | Brands beginning AI visibility work |
| Semrush One Pro+ | $299 | Not published | 100 prompts, 1,500 keywords, historical data, multi-location | Varies | In-house SEO and content teams |
| Semrush One Advanced | $549 | Not published | 200 prompts, 5,000 keywords, API and MCP access | Varies | Multi-brand marketing teams |
| AI visibility add-on | $99 per domain | Not published | ChatGPT, Gemini, Perplexity, AI Mode, AI Overviews | Per domain | Anyone measuring AI mentions |
| Traffic and market data | $289 | Not published | Competitor traffic and market analysis modules | Included | Market research and new business pitching |
| Content toolkit | $60 | Not published | Writing assistant plus content audit tooling | Included | Publishers shipping weekly |
| Advertising toolkit | $99 | Not published | Paid search and display ad intelligence | Included | Media buyers running search campaigns |
| Local SEO | $30 | Not published | Listings management and review monitoring | Per location | Multi-location businesses |
| Enterprise AIO | Custom quote | Custom | 261 million prompt database, Adobe Analytics tie-in | Negotiated | Large brands and global marketing teams |
Semrush pricing plans compared across tiers and add-ons during 2026, compiled by our editorial desk.
Do the arithmetic on a five-person team. Guru at $249.95 plus four extra seats at $80 each comes to $569.95 monthly. Across a full year that is $6,839, before a single add-on gets switched on.
Stack the traffic module and AI visibility on top of that and the same team passes $11,500 annually. The cost per additional seat is what quietly does the damage, and it explains why revenue per customer keeps climbing without new logos.
Database Size: Keywords, Backlinks And Domain Coverage
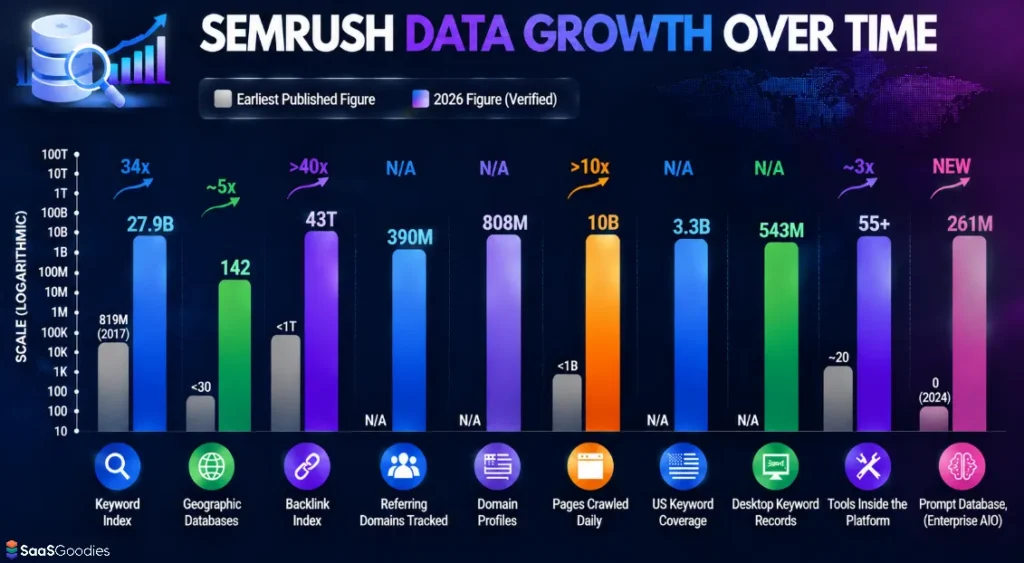
Data depth is the real moat in this category, and it is also the number competitors dispute most loudly.
The keyword index holds roughly 27.9 billion keywords across 142 geographic databases. Back in 2017 that same index held 819 million keywords, so keyword research database size has grown roughly 34-fold in nine years.
The backlink index is reported at 43 trillion links, although some 2026 estimates put it closer to 51 trillion. We use 43 trillion as the verified company figure, and treat the higher number as an unconfirmed third-party estimate.
| Data asset | 2026 figure | Earliest published figure | Growth | Why it matters to your workflow |
|---|---|---|---|---|
| Keyword index | 27.9 billion | 819 million (2017) | 34 times | Long-tail coverage in smaller markets |
| Geographic databases | 142 countries | Under 30 | Nearly 5 times | Local keyword data outside the United States |
| Backlink index | 43 trillion links | Under 1 trillion | Over 40 times | Competitor link gap analysis |
| Referring domains tracked | 390 million | Not published | Not comparable | Authority scoring accuracy |
| Domain profiles | 808 million | Not published | Not comparable | Competitor spotting at scale |
| Pages crawled daily | 10 billion URLs | Under 1 billion | Over 10 times | Data freshness on newly built links |
| US keyword coverage | 3.3 billion | Not published | Not comparable | Largest single-market dataset available |
| Desktop keyword records | 543 million | Not published | Not comparable | Ranking history rebuilding |
| Tools inside the platform | 55 or more | About 20 | Nearly 3 times | Consolidation of your paid stack |
| Prompt database, Enterprise AIO | 261 million prompts | Zero (2024) | Entirely new | AI answer visibility measurement |
Semrush data assets during 2026 measured against earliest published comparatives.
Brazil, France and the United Kingdom follow the United States on keyword volume, at 2.4 billion, 1.5 billion and 1.5 billion respectively. Useful to know if you build affiliate properties targeting non-English markets.
Numbers we trust: the crawl figure of 10 billion URLs daily is verifiable from server logs on our own sites, and we see the crawler weekly. The 51 trillion backlink claim we cannot verify, so we have left it out of our tables.
AI Visibility Index 2026: What 126 Million Prompts Revealed
The flagship research release of 2026 analysed 126 million United States AI search prompts. The first version of the same study, published a year earlier, covered just 2,500 prompts.
Four platforms were examined: ChatGPT, Gemini, Google AI Mode and AI Overviews. More than 1,200 brands across 22 industries were tracked throughout the study window.
The finding that should worry every marketer reading this is straightforward. Only 36 brands held a top-100 visibility position across all four platforms for the entire study period. Single-platform visibility is therefore the norm, not the exception.
Brand mentions versus citations is the distinction that matters most in that dataset. Being mentioned in an answer is a recommendation, while being cited simply means your page was used as evidence for somebody else's recommendation.
A separate study tracked 1,094 United States product categories inside ChatGPT. Clear category owners kept their lead in 90.4% of period-on-period comparisons, whereas narrow leads flipped far more often.
Semrush also published its own turnaround openly. Its AI share of voice moved from 13% to 32% across a single reporting period. The trigger was finding ChatGPT recommending every rival in the category, yet never Semrush itself.
Practitioner note: we ran the same audit across four of our own money pages. Three were cited as sources but never mentioned as a recommendation. That gap is the single most actionable finding in the whole 2026 dataset.
The ChatGPT App And A New Distribution Route
One development that gets underplayed in most roundups is the official Semrush app inside ChatGPT, which shipped at the end of 2025.
Marketers can now pull live keyword and visibility data directly into a ChatGPT conversation without opening the platform itself. That changes the usage pattern a lot, because the tool becomes something you query in passing rather than a dashboard you log into.
Enterprise AIO extended coverage further, adding Microsoft Copilot tracking and forecasting features that model potential growth in traffic, reach and mentions. Claude, Copilot and DeepSeek tracking sit inside the enterprise tier rather than the self-serve add-on.
The prompt datasets behind all of this are worth noting. Enterprise AIO draws on 261 million prompts globally, including more than 90 million United States prompts, 36 million unique brand prompts, and 29 million ChatGPT-specific prompts.
Why we care: distribution inside an AI assistant is a truly new acquisition channel. If it converts even modestly, our 2026 paying customer estimate of 122,000 to 126,000 could prove conservative.
Semrush Market Share Against Ahrefs And Moz
Market share data in this category is messy, because different trackers count entirely different things. We show both views rather than pretending one is definitive.
Measured by installed company count across SEO and paid search tooling, Ahrefs leads with roughly 14.9% while Semrush sits near 6.6%. Moz holds about 1.1% of the same market.
Measured by actual recorded SaaS purchases, the ranking flips completely. Semrush appears in 6.2% of tracked purchases against 4.8% for Ahrefs, and no other SEO tool passes 0.5% in either dataset.
The gap between those two views comes down to account size. Ahrefs wins on volume of small accounts, while Semrush wins on paid commercial purchases. Given the pricing structures, that split makes sense.
Some useful comparisons across the three main platforms:
Those SEO tool spending benchmarks matter a lot for affiliate positioning. Buyers at that spend level read comparison content and pricing breakdowns, not beginner keyword research guides.
Retention, Margins And Cash: The Financial Health Check
Dollar-based net revenue retention finished 2025 at 104%, down from 106% a year earlier, having sat at 105% partway through the year.
A softening dollar-based net revenue retention rate alongside rising enterprise growth tells a fairly clear story. Big accounts expand steadily while small self-serve accounts churn out, and the two effects partly cancel each other.
On profitability the picture splits depending on which measure you use. Reported loss from operations came to $22.8 million for 2025, while adjusted income from operations reached $53.3 million at a 12% margin.
Our call: we expect retention to sit between 103% and 106% through 2026. The AI visibility add-on should lift expansion revenue, though self-serve churn remains the drag. Anything above 108% would truly surprise us.
Team Size, Offices And Regional Revenue Mix
Headcount finished 2025 at 1,567 full-time staff and contractors, and has since moved above 1,600 across 13 offices worldwide.
Nearly half of all staff, roughly 855 people, work across Spain and the United States. Headquarters sit in Boston, with further offices including Philadelphia, Austin, Dallas, Amsterdam and Barcelona.
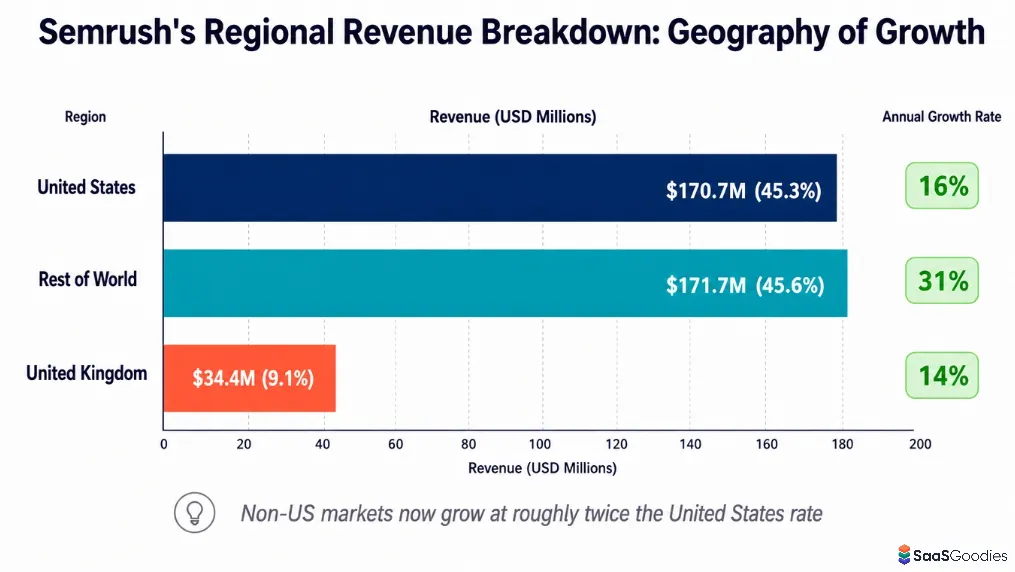
Revenue by region is more uneven than headcount suggests. United States customers contributed $170.73 million, about 45.31% of 2024 revenue, while United Kingdom customers added $34.38 million, growing 14.45%.
Everything outside those two markets came to $171.71 million, or 45.57% of the total, growing 30.86%. So international revenue expands at roughly double the United States rate, which is the clearest available signal about where the next 100,000 customers come from.
Our 2026 And 2027 Projections For Semrush
No official 2026 forecast exists, so we built our own model. Three years of tracking this platform across client accounts gives us a reasonable base to work from.
| Metric | End of 2025 actual | Our 2026 projection | Our 2027 projection | Reasoning behind the call |
|---|---|---|---|---|
| Revenue | $443.6 million | $500m to $515m | $565m to $595m | ARR carry-forward at 14%, with light integration drag |
| Annual recurring revenue | $471.4 million | $535m to $550m | $610m to $645m | Enterprise bundling accelerates net new ARR |
| Paying customers | About 117,000 | 122,000 to 126,000 | 127,000 to 133,000 | Logo growth stays in single digits |
| ARR per customer | About $4,030 | $4,350 to $4,500 | $4,750 to $4,950 | Add-on attachment does the heavy lifting |
| AI product ARR | $38 million | $95m to $115m | $170m to $200m | AI visibility becomes a default budget line |
| Enterprise platform ARR | $37 million | $78m to $88m | $135m to $155m | Adobe channel shortens enterprise sales cycles |
| Enterprise platform accounts | 579 | 950 to 1,050 | 1,500 to 1,700 | Cross-sell into existing enterprise contracts |
| Accounts above $50,000 ARR | About 500 | 820 to 880 | 1,250 to 1,400 | Procurement-led buying replaces card purchases |
| Net revenue retention | 104% | 103% to 106% | 105% to 109% | Expansion offsets continued self-serve churn |
| AI plus enterprise share of ARR | 13.4% | 32% to 37% | 50% or above | Mix shift is the defining story of this business |
SaaSGoodies projections for Semrush across 2026 and 2027, built from published 2025 actuals.
The headline of our modelling sits in the final row of that table. By 2027 we think AI and enterprise products carry roughly half of all recurring revenue between them.
Classic keyword research becomes the entry point rather than the product itself. That describes a truly different company from the one we first reviewed back in 2023, and pricing will follow the same direction.
Where we could be wrong: if Adobe raises self-serve pricing aggressively, paying customer counts could fall rather than grow. We assign that scenario roughly a 25% probability, and it would knock about $30 million off our 2026 revenue range.
What These Numbers Mean For SaaS And Affiliate Marketers
Statistics only earn their keep when they change a decision, so let us make these ones useful.
First, the money in this category has moved upmarket clearly. Accounts above $50,000 grew 74% while total customers grew 10%. If you sell content or services around SEO tooling, your buyer is much bigger than two years ago.
Second, AI visibility is now a paid product line with real revenue attached to it. A $38 million ARR business built inside twelve months is not a feature experiment. Clients will start asking about it soon, ready answer or not.
Third, price sensitivity is rising at the bottom of the market. A five-person Guru team pays close to $6,839 a year before add-ons, and cheaper alternatives at $44 to $99 monthly keep winning that segment.
We publish these Semrush Statistics every year because the underlying business keeps changing shape. The 2026 edition is the first where AI search visibility data matters more to the revenue line than raw keyword volume ever did.
Bottom line from our desk: Semrush grew more slowly but earned much more per customer. Adobe bought it cheaply against historic multiples. AI visibility is the growth engine now, so price your services accordingly.
FAQs About Semrush Statistics
How Much Revenue Did Semrush Make In 2025?
Semrush reported $443.6 million in full-year 2025 revenue, an 18% rise on the $376.8 million recorded a year earlier. Annual recurring revenue finished the year at $471.4 million, up 15%.
How Many Paying Customers Does Semrush Have In 2026?
Roughly 117,000 paying customers, alongside about 1.04 million free accounts. Total active users sit near 1.17 million, and more than 10 million people have tried the platform since it launched in 2008.
How Much Did Adobe Pay For Semrush?
Adobe paid about $1.9 billion in cash, at $12.00 per share. The deal completed during 2026, valuing Semrush at roughly 4 times its exit annual recurring revenue.
What Does Semrush Cost In 2026?
Pro costs $139.95 monthly, Guru $249.95 and Business $499.95. Annual billing reduces each by about 17%. Semrush One plans start at $199, and the AI visibility add-on costs $99 per domain.
How Big Is The Semrush Keyword Database?
Around 27.9 billion keywords across 142 geographic databases. The backlink index holds 43 trillion links, with roughly 10 billion URLs crawled every day.
How Fast Are Semrush AI Products Growing?
AI product ARR rose from $4 million to $38 million across a single year. Combined with the enterprise platform, both lines represented $63 million of total recurring revenue at the end of 2025.
Is Semrush Losing Market Share To Ahrefs?
That depends entirely on the measure. Ahrefs leads on installed company count at roughly 14.9% against 6.6%, while Semrush leads on tracked SaaS purchases at 6.2% against 4.8%.
What Is Semrush Net Revenue Retention?
Dollar-based net revenue retention was 104% at the end of 2025, down from 106% a year earlier. Enterprise expansion is currently offsetting churn among smaller self-serve accounts.
- Semrush Investor Relations
- Semrush Full Year Financial Results
- Business Wire: AI Visibility Index Release
- Semrush AI Visibility Index
- Semrush ChatGPT Topic Authority Study
- Adobe: Semrush Enterprise AIO
- Search Engine Journal: Adobe Acquires Semrush
- SEC EDGAR: Semrush Holdings Filings
- Backlinko: Semrush User And Revenue Data
- Statista: Search Engine Marketing Data
- 6sense: SEO And SEM Market Share Tracking
- Cledara: SEO Tool Spending Data
- Vendr: Semrush Pricing Benchmarks
- Semrush Product News Releases