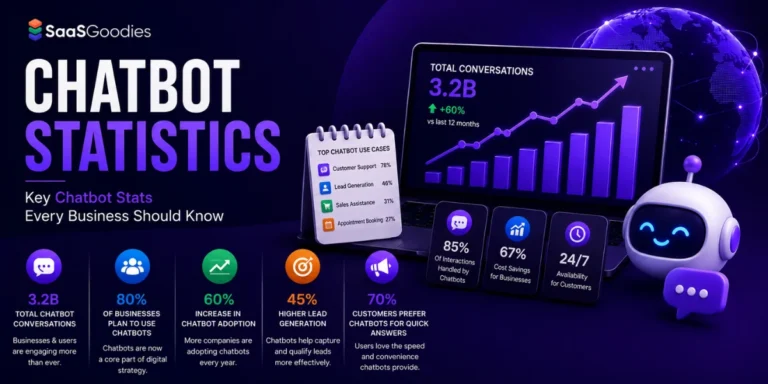
SaaS Conversion Rate Statistics 2026: Real Funnel Numbers

The median SaaS free-to-paid conversion rate in 2026 sits near 8%, and almost nobody actually lands there. Opt-in trials convert around 8.9%. Credit card trials clear 30%. Freemium crawls along at 5.6%. Visitor-to-lead on a B2B SaaS site?
A brutal 1.1% to 2.5%. We run funnels for a living, so these SaaS Conversion Rate Statistics come with receipts, not vibes.
Tattoo one number on your monitor: a single point of conversion lift is worth roughly 15% more revenue per trial cohort. Same traffic. Same spend. Bigger cheque.
SaaS Conversion Rate Statistics 2026 at a Glance
Here are the figures we lean on most when we audit a funnel. Skim these first, then read the sections that sting.
What Counts as a Good Free-to-Paid Conversion Rate?
First rule we teach: your benchmark depends on your model, not on some blended industry number. A 10% rate can be elite or embarrassing. Depends entirely on how you sell.
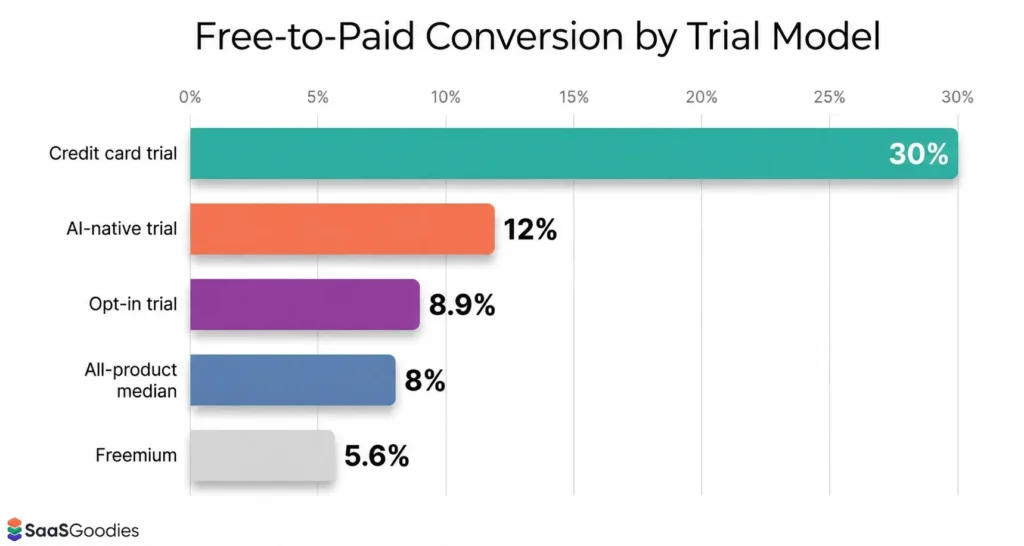
Here is how the 2026 numbers shake out by model. “Good” is roughly the 50th percentile. “Great” is roughly the top 25%.
| Trial model | Average free-to-paid | Good (50th pct) | Great (75th pct) | What it signals |
|---|---|---|---|---|
| Credit card required trial (opt-out) | 30% to 31% | 25% to 35% | 50% to 60% | High intent, low volume, revenue validated fast |
| AI-native product trial | 10% to 12% | 6% to 8% | 15% to 20% | Fast value, sticky habit loops, strong pull |
| Opt-in free trial (no card) | 8.9% | 4% to 6% | 10% to 15% | Wider top of funnel, softer commitment |
| Freemium (self-serve) | 5.6% | 3% to 5% | 8% to 12% | Widest funnel, slowest monetisation |
Notice the credit card column. Asking for a card upfront filters out tyre-kickers before they ever touch your product. Fewer people enter. Far more people pay.
Credit card trials tower over every other model on raw conversion, but they thin the top of the funnel first.
Why the 8% Average Quietly Lies to You
Here is the reality check the screenshots skip. Very few products actually convert at 8%. The number is a statistical ghost.
When 200 B2B products were measured in early 2026, the results split into two camps. One cluster sat below 2.5%. Another cluster sat above 25%. The middle was nearly empty.
So the “average” describes a place almost no product lives. Chasing it is like aiming for the average house price and expecting to land in a real house.
What actually matters:
That third one separates operators from spreadsheet tourists. A rate that climbed because a big brand ran a promo tells you nothing repeatable.
Here is the maths that makes this concrete. Two products can both report a 12% trial-to-paid rate. One earns it from tight organic traffic and a fast onboarding win. The other buys the same headline number with a card gate that scares off 90% of would-be signups.
Same percentage, completely different businesses. The first one scales. The second one is quietly starving its own funnel.
So when a founder tells us their conversion rate, our first question is never “is that good”. It is “good compared to what, and measured how”. Until you pin down the model, the traffic mix and the conversion window, the number is just a decoration.
SaasGoodies take: internal benchmarking beats industry benchmarking every time in 2026. Buyer behaviour is shifting fast, so the outside numbers describe a world that keeps changing under your feet.
Trial Model Face-Off: Opt-In vs Opt-Out vs Freemium
Raw conversion rate is a liar without a denominator. A model with a “higher” percentage can still produce fewer paying customers, because it starts fewer people.
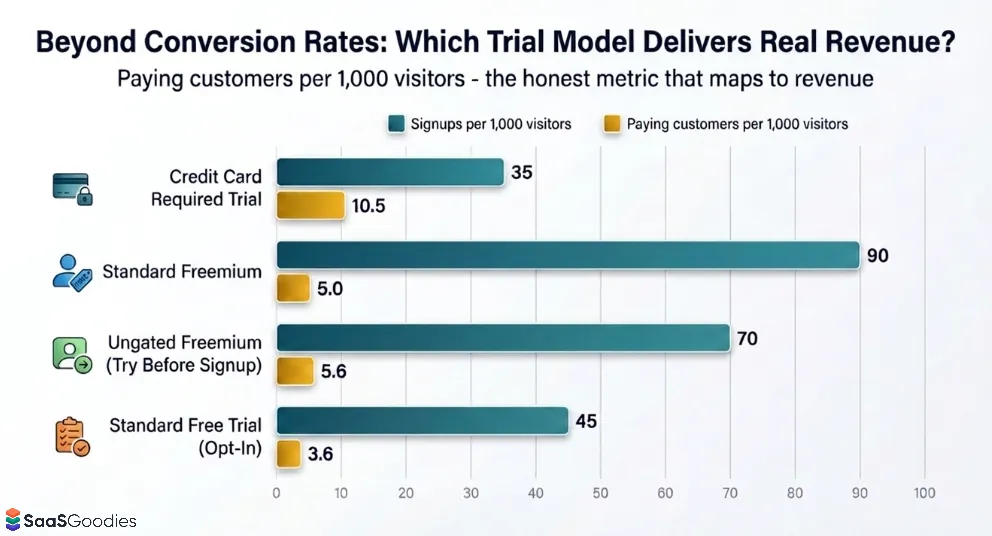
The honest way to compare is paying customers per 1,000 website visitors. That folds signup rate and conversion rate into one number that maps to revenue.
| Model | Signups per 1,000 visitors | Paying customers per 1,000 visitors | Best fit |
|---|---|---|---|
| Credit card required trial | 35 | 10.5 | Expensive traffic, fast revenue proof |
| Ungated freemium (try before signup) | 70 | 5.6 | Instant value, viral loops |
| Standard freemium | 90 | 5.0 | Broad base, network effects |
| Standard free trial (opt-in) | 45 | 3.6 | Guided setup, sales assist |
Read that table twice. Freemium generates roughly double the signups of a standard trial, yet the paying customers per visitor land in a similar zone. The credit card model prints the most payers per visitor by a mile.
Conversion percentage without the signup rate is marketing folklore. Payers per visitor is the number that pays your salary.
The takeaway is not “always ask for a card”. Cards suit pricey traffic and simple products. Freemium suits products that click in minutes and spread on their own. Match the model to the buyer, not to the flashiest percentage.
Trial Length and Structure: How Most SaaS Products Set It Up
Before you tune conversion, know what “normal” looks like. Trial design in 2026 is more uniform than founders assume, and copying the herd is not always the right move.
The most common shape by far is a 14-day free trial. About 62% of products run it. Another 14% run a 7-day window, and 14% stretch to 30 days. So most of the market clusters on two weeks.
Here is what the setup data tells us:
The worst setup we see is the timid middle ground. A free experience so limited it drives no real adoption, yet so generous it creates zero urgency to pay. That combination converts nobody.
Trial length itself is a lever. Too short and users never reach value. Too long and free riders settle in. Most teams land near 14 to 21 days for a reason. It gives people time to hit their first win without letting the habit go stale.
SaasGoodies take: shorten the trial before you extend it. A 7-day window with tight onboarding usually converts better than a lazy 30-day one, because urgency does half the selling for you. Length is not generosity, it is pacing.
Where Visitors Leak: The B2B SaaS Funnel Stage by Stage
Zoom out from the trial and the picture gets humbling. On a full funnel basis, roughly one in a thousand site visitors becomes a paying customer. That is not a typo.
Every stage sheds people. Knowing the normal drop at each stage tells you where your funnel is actually broken versus where it just looks bad.
| Funnel stage | Average B2B SaaS rate | Top 10% rate | Notes |
|---|---|---|---|
| Visitor to lead / signup | 1.5% to 2.5% | 8% to 15% | Below 0.7% signals a page or intent problem |
| Trial or free tier to activated user | 37.5% average activation | Above 50% | The “aha moment” gate |
| MQL to SQL | 32% to 40% | 39% to 40% | All-B2B average is only 13%, so SaaS runs high |
| Demo to opportunity | 60% to 80% | Above 90% | Tracks sales-call quality and fit |
| SQL to closed won | 20% to 25% | Above 30% | Qualification and pricing clarity drive this |
| Visitor to paying customer (full funnel) | About 0.10% | Multiples higher | One paying customer per 1,000 visitors |
The MQL-to-SQL stage is where most funnels quietly bleed out. A rate under 10% almost always means bad lead scoring or a marketing and sales team using different definitions of “qualified”.
One more number worth burning in: a lift from 2% to 3% at the visitor stage can mean a 25% to 40% pipeline increase downstream. Small top-of-funnel gains compound through every stage below.
SaasGoodies take: stop obsessing over the trial-to-paid number in isolation. Find the single stage furthest below its benchmark, fix that, and the whole funnel lifts. Chasing every stage at once is how teams spin for a year with nothing to show.
Landing Page Conversion Numbers Worth Copying
Your landing page conversion rate is the first real filter. Get it wrong and every downstream stage inherits a smaller, worse pool.
Across all industries the median landing page converts at 6.6%. SaaS sits lower at 3.8% median, and a strict B2B SaaS visitor-to-lead read drops to about 1.1%. Different measures, different truths, so always check what a benchmark is counting.
| Landing page metric | 2026 figure | Why it matters |
|---|---|---|
| Cross-industry median | 6.6% | Broad baseline, inflated by low-friction B2C pages |
| SaaS median | 3.8% | The realistic SaaS starting line |
| Top 25% of pages | 5.31% and up | The bar for “good” |
| Top 10% of pages | 11.45% and up | The bar for “great” |
| Custom page vs template | 11.6% vs 3.8% | Purpose-built beats generic 3x |
| Single-CTA vs multi-CTA | 13.5% vs 10.5% | One choice converts better than many |
The gap between average and top decile inside the same vertical is three to five times. That gap almost never closes by buying more traffic. It closes on the page itself.
The levers that actually move a page, ranked by how often we see them pay off:
Quick reality note on devices. Mobile drives about 82.9% of traffic, yet desktop converts roughly 8% better. So build mobile pages to capture and research, then re-engage those users on desktop where the buying happens.
Which Traffic Channels Actually Turn Into Money
Not all clicks are equal. The channel a visitor arrives from tells you a lot about how likely they are to ever pay.
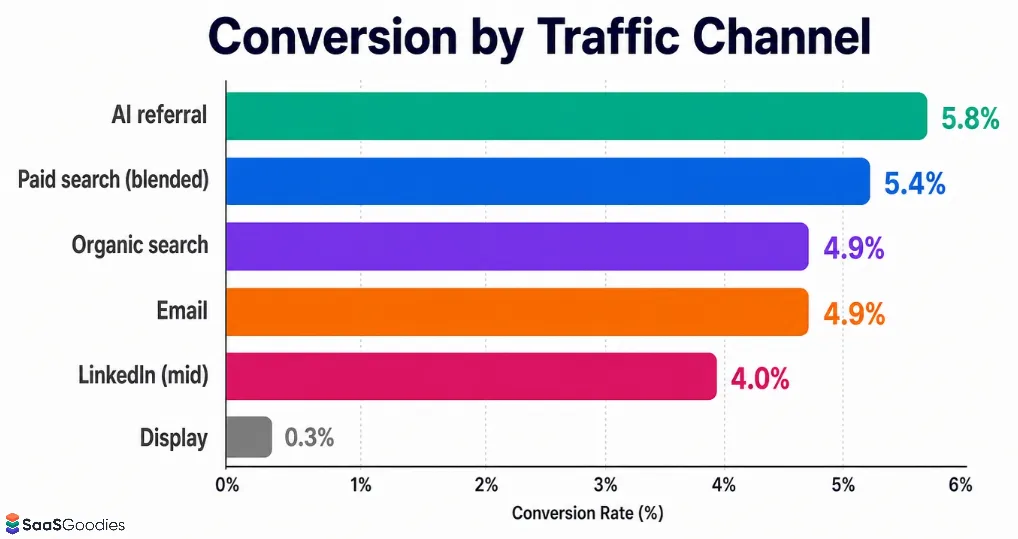
The headline of 2026 is a channel that had no benchmark a year ago. AI referral traffic now converts higher than organic search. When someone arrives from an AI assistant, they have already asked a specific question and been handed a specific answer. They land pre-qualified.
| Channel | Average conversion | Read on it |
|---|---|---|
| AI referral (ChatGPT, Perplexity, Gemini, Claude) | 5.8% | Highest converting source, pre-qualified intent |
| Paid search (blended) | 5.4% | Strong when ad-to-page message is tight |
| Organic search | 4.9% | Dependable core, but AI Overviews are eating clicks |
| 4.9% | Warm traffic, under-resourced by most teams | |
| Paid search (SaaS-specific) | 4.1% | Converts worse in SaaS than cross-industry |
| LinkedIn (B2B blended) | 2% to 6% | Precise targeting, premium cost |
| Display | 0.3% | 333 visitors for a single conversion |
Two numbers deserve a second look. SEO-sourced leads convert MQL-to-SQL at about 51%, versus 26% for paid search leads. Intent shows up in the quality, not just the volume.
And the AI story gets wild at the extreme. One well-known site reports traffic from ChatGPT converting at 24%, roughly six times its Google-sourced traffic. That is not a rounding error. That is a new front door.
Conversion Rates by SaaS Vertical: Who Converts, Who Struggles
Your category sets your ceiling as much as your craft does. A visitor buying CRM software behaves nothing like a visitor evaluating cybersecurity, where five stakeholders and a security review stand between click and cash.
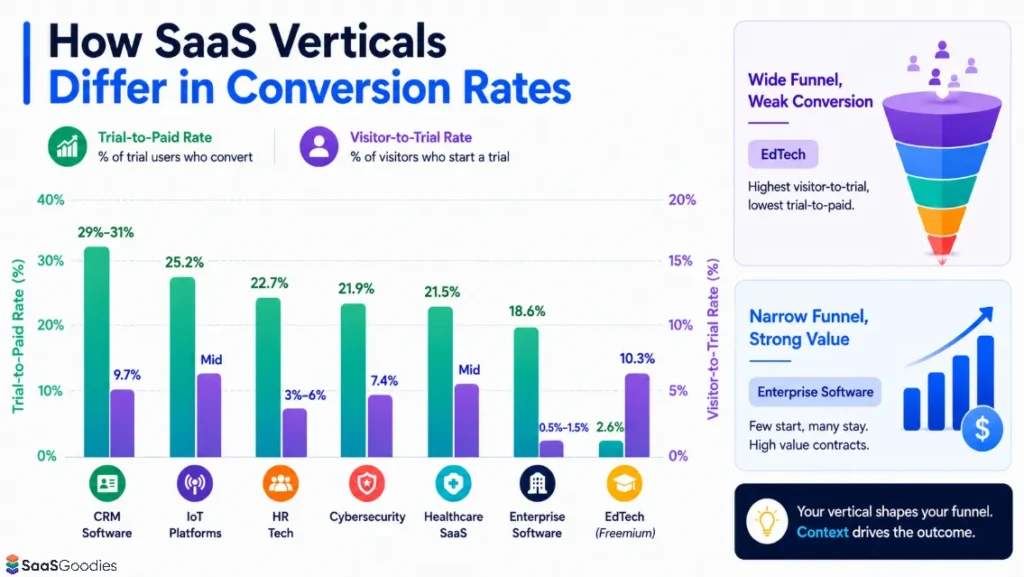
These SaaS Conversion Rate Statistics by vertical show how wide the spread runs. Trial-to-paid rates below assume opt-in models unless noted.
| Vertical | Trial-to-paid rate | Visitor-to-trial rate | Why it lands there |
|---|---|---|---|
| CRM software | 29% to 31% | 9.7% | Clear ROI, fast personal upside |
| IoT platforms | 25.2% | Mid | Concrete use case, technical buyers |
| HR tech | 22.7% | 3% to 6% | Buyers often arrive with demo intent |
| Cybersecurity | 21.9% | 7.4% | Long, risk-heavy evaluations |
| Healthcare SaaS | 21.5% | Mid | High switching costs, strict qualification |
| Enterprise software | 18.6% | 0.5% to 1.5% | Committees, procurement, security gates |
| EdTech | Freemium 2.6% | 10.3% | Huge top of funnel, weak monetisation |
EdTech is the cautionary tale. It pulls the widest visitor-to-trial rate in the table, then converts the fewest of those free users to paid. Big funnel, leaky bucket.
Enterprise is the mirror image. A tiny fraction start a trial, but the ones who buy sign contracts that carry the whole model. Low conversion, high value. Both can be healthy. Context is everything.
How AI Is Rewriting SaaS Conversion in 2026
AI is not a side note this year. It sits on both sides of the funnel, pushing some numbers up and quietly dragging others down.
On the demand side, buyers now ask ChatGPT, Claude or Perplexity to shortlist SaaS tools before they touch a single vendor site. By the time they arrive, half the evaluation is done. That is why AI referral traffic converts so well.
On the search side, AI Overviews now appear on about 13.14% of queries, up from 6.49% a year earlier. In some categories that reaches nearly 33%. Fewer informational clicks reach your site, so thin blog traffic that never converted anyway is drying up. No great loss, but it stings vanity metrics.
Inside the product, the wins are real:
Then there is the death of the form. Median demo request form completion slid from 4.7% in 2022 to 2.1% in 2026.
Demo show rates fell from 58% to 41% over the same window. Teams swapping static forms for conversational AI intake report 2x to 4x lifts in qualified pipeline on the same ad spend.
SaasGoodies take: the single highest-return move for most SaaS sites in 2026 is getting cited by AI assistants. That traffic converts better than anything you are already running, and almost nobody has optimised for it yet. Early movers are printing money on a channel their competitors cannot even see.
The Conversion Levers That Move the Needle Fastest
Benchmarks tell you if you have a problem. Levers tell you what to pull. Here are the ones we reach for first, because they pay back inside a month or two.
One stat to keep you honest: the average SaaS activation rate is 37.5%, and improving it by just 25% can drive a 34% revenue boost. Activation, not acquisition, is usually the cheapest revenue in the building.
What We Expect for SaaS Conversions Beyond 2026
Here is where we put our own neck out. These are our calls, based on the numbers above and years of watching funnels move.
None of this is fortune telling. It is where the 2026 data already points, extended one step forward.
SaaS Conversion Rate FAQs
What is a good SaaS conversion rate in 2026?
It depends on your model. A good free-to-paid conversion rate is 4% to 6% for opt-in trials, 3% to 5% for freemium, and 25% to 35% for credit card required trials. On the website side, a good B2B SaaS visitor-to-lead rate is 2% to 5%.
What is the average free trial to paid conversion rate?
The median across B2B software products in 2026 is about 8%. Opt-in trials average 8.9%, credit card trials sit near 30%, and freemium averages 5.6%. Almost no product actually converts at the 8% median because the distribution is bimodal.
Why does the credit card trial convert so much higher?
Asking for a card upfront filters out casual browsers before they enter. Fewer people start, but the ones who do carry real intent, so the trial-to-paid conversion rate runs more than 5x an opt-in trial. It trades signup volume for payer quality.
Which traffic channel converts best for SaaS?
AI referral traffic from assistants like ChatGPT, Perplexity, Gemini and Claude converts at about 5.8%, ahead of organic search and email. The visitor arrives pre-qualified because the assistant already answered their question.
How much revenue does a small conversion lift create?
A 1 percentage point improvement in free-to-paid conversion equals roughly 15% more new revenue per trial cohort. It needs no extra headcount and no extra ad spend, which is why conversion work is the highest-return growth lever most SaaS teams own.
Is freemium or free trial better in 2026?
Neither wins on paper. Freemium produces about double the signups but a lower conversion percentage, so paying customers per visitor end up similar. Pick freemium for products that deliver value in minutes, and a free trial for products that need guided setup.
- ChartMogul, ProductLed and Growth Unhinged | SaaS Conversion Report, January (200 B2B products)
- First Page Sage | SaaS Free Trial and Freemium Conversion Rate Benchmarks
- First Page Sage | Landing Page Conversion Rates by Industry
- Pulseahead | Trial-to-Paid Conversion Benchmarks in SaaS
- Ruler Analytics benchmark (via SerpSculpt) | B2B Sales Conversion Rate by Industry
- SaaS Hero | B2B SaaS Conversion Rate Benchmarks and CRO Guide
- getperspective.ai | The End of the Demo Request Form: SaaS Conversion Benchmarks
- Userpilot | SaaS Average Conversion Rate Benchmarks
- LanderLab | Landing Page Conversion Rate Benchmarks by Industry
- Konabayev | B2B SaaS Conversion Rate Benchmarks by Funnel Stage
- ADV.me | B2B SaaS Lead Conversion Benchmarks: Full-Funnel Numbers
- GrowthSpree | B2B SaaS Demo Show Rate Benchmarks