Vertical SaaS Statistics: Market Size, Growth & Trends (2026)

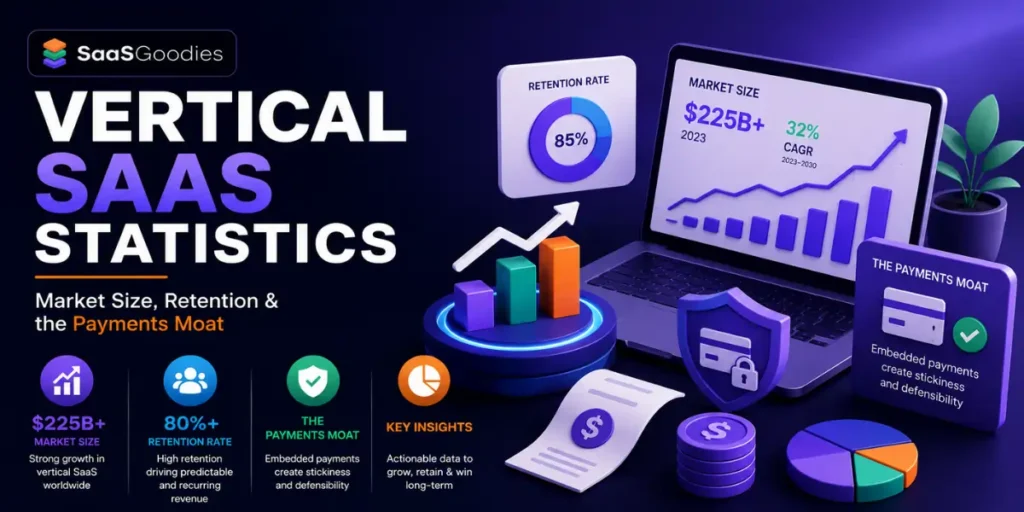
Here is the number that reframes the whole category: Toast — a restaurant software company — now earns the majority of its revenue from payments, not software subscriptions.
That single fact explains why investors paid a 41% valuation premium for vertical SaaS over horizontal software in 2025, and why the next wave of billion-dollar software companies looks less like Slack and more like a plumbing-dispatch tool with a payments licence.
Vertical SaaS is cloud software built for one industry — restaurants, construction, healthcare, home services — encoding that sector's specific workflows, compliance and data, as opposed to horizontal SaaS (Salesforce, Slack, HubSpot) that sells broadly across every industry.
This roundup pulls together the verified vertical SaaS statistics on market size, growth, retention, valuations and the embedded-payments engine — and it corrects one widely-repeated myth about retention along the way. Every figure is sourced and dated.
Key Vertical SaaS Stats At a Glance
What is Vertical SaaS, and How is it Different from Horizontal?
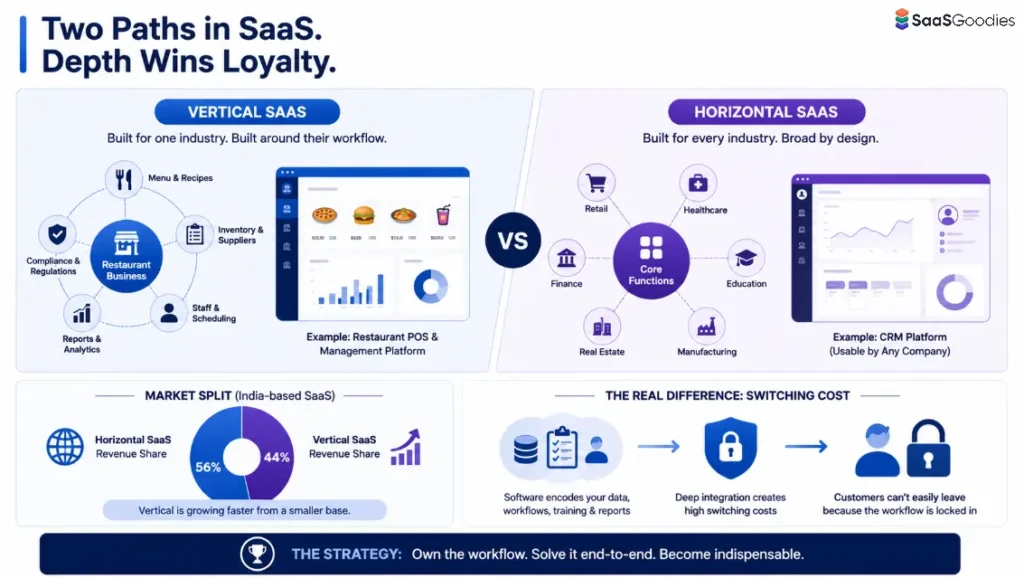
Vertical SaaS is software purpose-built for a single industry, encoding that sector's workflows, regulations and data formats; horizontal SaaS is broad, function-based software that sells across every industry.
A restaurant POS-and-management platform is vertical. A CRM that any company can use is horizontal.
The whole investment thesis rests on that depth: own the workflow so completely that the customer cannot turn the product off.
Translation for operators: “niche” is the moat, not the limitation. The narrow product is the one that becomes irreplaceable.
How Big is The Vertical SaaS Market in 2026?
The vertical software market is worth roughly $164 billion in 2026 and is forecast to more than triple by the early 2030s.
Estimates vary by definition, so here is the honest spread rather than one false-precision figure.
| Source | 2026 market size | Forecast | CAGR |
|---|---|---|---|
| Mordor Intelligence | $164.06bn | $282.98bn (2031) | 11.52% |
| Business Research Insights | $143.45bn | $499.42bn (2035) | 16.3% |
| Windsor Drake (2025 figure) | $157.4bn (2025) | — | — |
The spread between an 11.5% and a 16.3% CAGR is the difference between “fast-growing software segment” and “one of the fastest in tech” — and it depends entirely on whether you count only pure-play verticals or every industry-cloud module.
Translation for operators: when a vendor quotes you a vertical SaaS market size, ask which definition. The headline number swings by $40 billion on methodology alone.
Is Vertical SaaS Really Growing Faster than Horizontal?
Yes — modestly on conservative definitions, sharply on aggressive ones — and the gap is widening because horizontal categories have saturated their core buyers. This is one place the hype is mostly earned.
The mechanism is straightforward: a company choosing a CRM in 2026 picks from a crowded, commoditised field, while a community bank or a dental chain still has unsolved, compliance-heavy problems no horizontal tool addresses.
Does Vertical SaaS Actually Retain Customers Better?
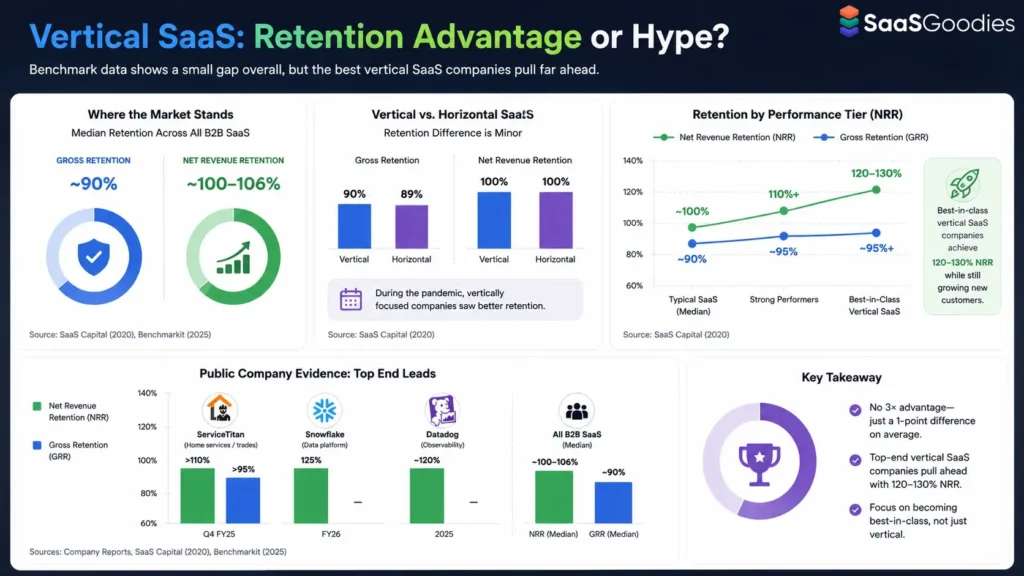
This is the most over-claimed statistic in the category, so here is the reality check: SaaS Capital's benchmark data shows the retention difference between vertical and horizontal SaaS is “minor and mixed” — not the 3× advantage that circulates online. The stickiness is real at the top end; the average is closer than the marketing suggests.
The public-company evidence backs the top-end story, not the “3×” claim:
| Company | Vertical | Net retention | Gross retention |
|---|---|---|---|
| ServiceTitan | Home services / trades | >110% (Q4 FY25) | >95% (FY25) |
| Snowflake | Data platform (consumption) | 125% (FY26) | — |
| Datadog | Observability (consumption) | ~120% (2025) | — |
| All B2B SaaS (median) | — | ~100–106% | ~90% |
Translation for operators: vertical SaaS is sticky, but if a vertical product's NRR only matches the horizontal median, it is underperforming its real peer set. Judge a vertical platform against 120%, not 100%.
Why do Investors Pay a Premium for Vertical SaaS?
Because vertical platforms own the workflow, the compliance layer, the data and increasingly the payment rails of an industry — and that combination commands record valuation multiples. The premium is the clearest signal in the category.
| Segment | 2025 revenue multiple |
|---|---|
| Healthcare IT | 8.5× |
| Construction tech | 7.5× |
| Legal tech | 7.0× |
| Generic horizontal SaaS | 4.1× |
The catch worth flagging: these are deal-level multiples from M&A and private rounds, not public-market averages, and they skew toward the verticals with embedded fintech upside. A vertical SaaS company without a payments or compliance layer does not automatically earn 8.5×.
Translation for operators: the multiple follows the moat — workflow ownership plus monetisation depth, not the label “vertical” on its own.
How Does Vertical SaaS Make Money Beyond Subscriptions?
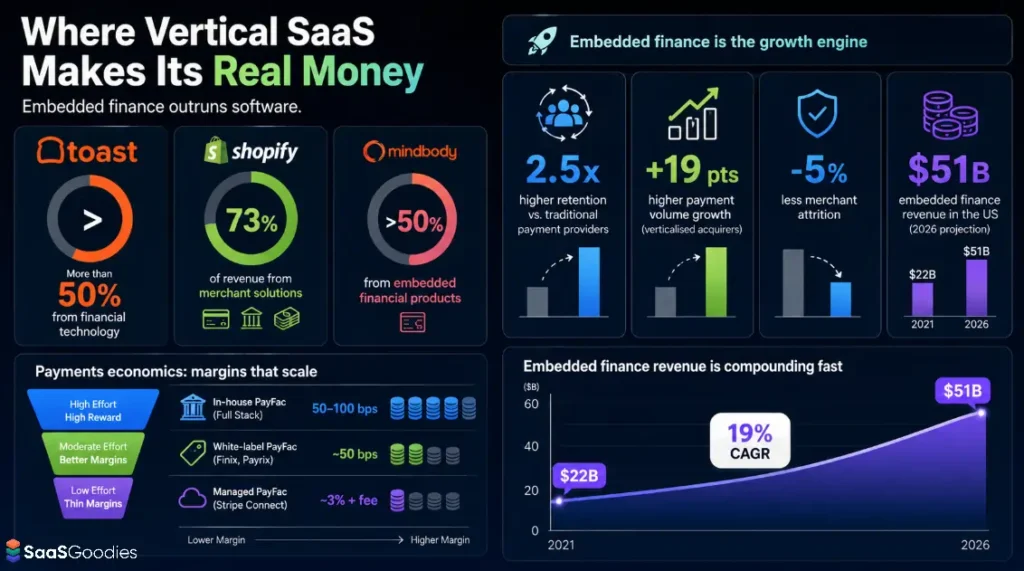
Embedded payments — and increasingly lending and banking — now out-earn software subscriptions at the leading vertical platforms. This is the real business model, and it is the part horizontal SaaS structurally cannot copy.
The economics of how a platform monetises payments matter, and the margins are unforgiving:
| Payments model | Margin captured per transaction | Requirement |
|---|---|---|
| Managed PayFac (e.g. Stripe Connect) | ~3% + per-txn fee (thin net) | Low |
| White-label PayFac (Finix, Payrix) | ~50 bps | Moderate |
| Full in-house PayFac (Toast model) | 50–100 bps | $50m+ annual volume + compliance |
A company processing $100 million a year through a managed PayFac leaves roughly $500,000 of margin on the table versus owning the stack.
Translation for operators: subscriptions get a vertical SaaS company in the door; payments are where the revenue-per-customer — and the valuation — actually compounds.
For affiliates, this is the quiet upside: vertical SaaS programmes tend to carry higher ACV and stickier customers than commodity tools, which supports the kind of recurring SaaS commissions worth building content around. Browse the SaaS programme directory and run the numbers with the commission calculator.
Which Industries Dominate Vertical SaaS?
Healthcare leads, but the highest-growth verticals are the ones with messy, compliance-heavy, payments-adjacent workflows. The category is broad and uneven.
ServiceTitan's scale shows how deep a single trade vertical can go: $771.9 million in FY2025 revenue (up 26%), $68.5 billion in gross transaction volume and roughly 9,500 active contractor customers. That is a near-billion-dollar software business built on plumbers and electricians.
Translation for operators: the boring, unglamorous, paper-heavy industries are where the open vertical SaaS opportunities still sit.
What These Statistics Mean for 2026
The data tells a consistent story, with three honest caveats.
The moat is monetisation depth, not the vertical label. Toast and Shopify earning most of their revenue from payments is the template. The caveat: full payments ownership needs $50 million+ in volume and serious compliance infrastructure — it is not a switch a sub-scale company flips.
Retention is strong but not magic. The top vertical companies hit 120–130% NRR, but the category average sits near the all-SaaS median. The caveat: “vertical retains 3× better” is a myth — promote it and a sharp reader stops trusting the rest of the page.
Valuation premiums reward depth, and AI is widening the gap. Vertical SaaS earned a 41% premium in 2025 precisely as AI commoditised generic horizontal tools. The caveat: those are deal-level multiples skewed toward fintech-enabled verticals, not a guarantee for every industry-specific tool.
For the SaaS programmes with the ACV, retention and recurring structures worth building campaigns around, browse the SaaS reviews hub and the affiliate programme directory. For founders weighing a vertical play, the SaaSGoodies guides hub covers the build-versus-buy maths.
- Toast, Inc. — Form 8-K, Q3 2025 results (SEC).
- ServiceTitan — Fiscal Q4 and Full-Year FY2025 results.
- Mordor Intelligence — Vertical Software Market report (2026).
- Business Research Insights — Vertical SaaS Market report.
- SaaS Capital — B2B SaaS Retention Benchmarks (2023; 2020).
- Bowery Capital — Surveying Vertical SaaS key metrics.
- SaaSrise — Vertical SaaS M&A / VC Report 2026 (multiples, premium, VC).
- Apideck — Embedded Finance for Vertical SaaS (Toast/Shopify/Mindbody, BCG & Adyen, Visa, Fractal).
- SaaS Mag — Vertical SaaS outperforming horizontal; NRR defining metric; niche beats horizontal (BCG embedded finance).
- Zylo — SaaS statistics 2026 (market size, India vertical/horizontal split).
- QuantumRun — SaaS industry growth statistics (vertical vs horizontal growth).
- Technavio — SaaS market size and forecast 2026–2030.
- ServiceTitan S-1 breakdown (ARR, GTV) — Mostly Metrics.
- SaaS Ultra — Vertical vs horizontal SaaS (switching costs).
- Tech Insider — The rise of vertical SaaS (PitchBook VC figure, embedded finance).