Email Open Rate & CTR Benchmark Statistics by Industry 2026

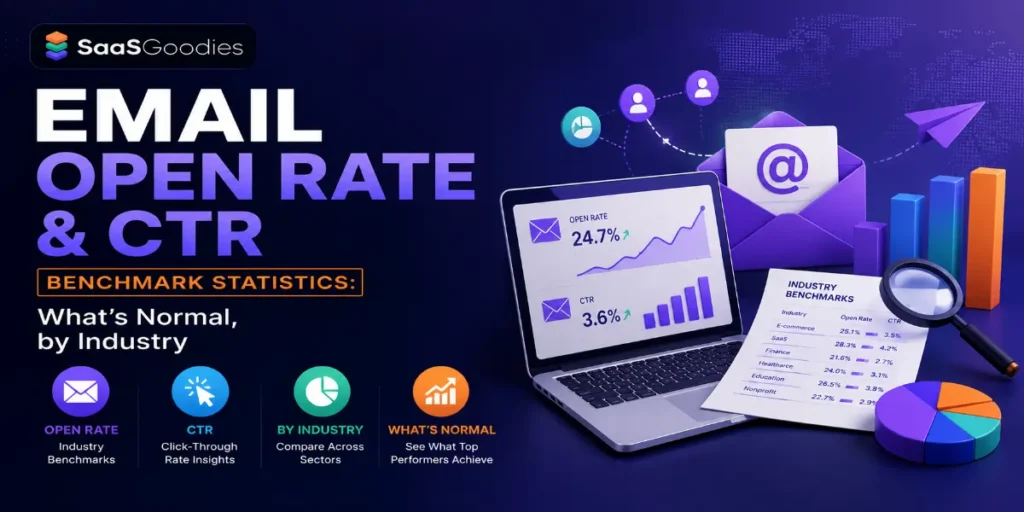
The “average” email open rate in 2026 is anywhere from 21.5% to 55.71% depending on which report gets cited — and every one of those numbers is technically correct.
That spread is the single most important fact in email benchmarking, and almost no roundup admits it. An email benchmark is the average performance — open rate, click-through rate, click-to-open rate, unsubscribe rate — for campaigns across an industry, used to judge whether a given program is ahead of or behind its peers.
The figures below come from the platforms that actually run the sends — MailerLite, Klaviyo, Mailchimp, GetResponse, ActiveCampaign and Omnisend — every number cited, dated, and shown next to the reason the sources disagree.
The aim is a benchmark page operators can use to set realistic targets, not a tidy single number that falls apart on contact with reality.
Key Email Open Rate & CTR Benchmark Statistics
What is a good email open rate in 2026?
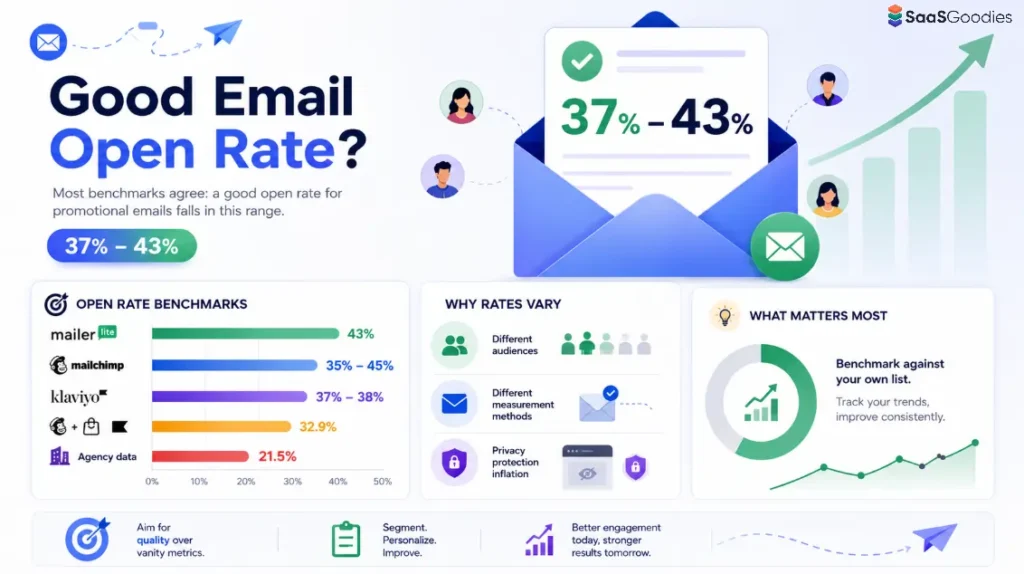
A defensible “good” open rate sits between 37% and 43% for promotional email — but the honest answer is that the benchmark depends entirely on which platform measured it.
Before trusting any single figure, look at how wildly the sources diverge.
| Source | Reported average open rate | Basis |
|---|---|---|
| MailerLite | 43.46% | 3.6M campaigns |
| Mailchimp | 35–45% | Billions of emails |
| Klaviyo (promotional) | 37–38% | E-commerce dataset |
| Multi-platform average | 32.86% | Mailchimp/Omnisend/Klaviyo/Brevo |
| Agency benchmark | 21.5% | MPP-adjusted |
Why the chasm? Three reasons: different audience mixes (MailerLite skews to creators and small business; Klaviyo to e-commerce), different counting methods, and Apple Mail Privacy Protection, which pre-loads images and registers an “open” whether or not the email was read.
What this means for operators: never benchmark against a single global open rate — it is methodology soup. Pick the platform whose audience matches yours, or better, benchmark against your own list's trailing average. A 35% open rate is “behind” on MailerLite and “ahead” on the agency dataset. The number alone tells you nothing without its source.
Why is the open rate broken — and what replaced it?
Apple Mail Privacy Protection affects roughly 50–60% of recorded opens and inflates open rates by 10 to 18 points, which is why click-to-open rate and conversion are now the metrics that matter. MPP launched in September 2021 and quietly broke the industry's favourite vanity metric.
What this means for operators: if a report opens with a 40%+ average open rate and no MPP caveat, treat it with suspicion. The metric is real but distorted. Steer by clicks, click-to-open and revenue per send — those survive the privacy layer. Reporting “open rate up 5%” to a client in 2026 without context is, charitably, optimistic.
What are email open rates by industry?
Open rates by industry ranged from 30.10% to 55.71% in 2025, with religion, hobbies and non-profit at the top and travel, e-commerce and publishing at the bottom. Passion beats promotion — the sectors people want to hear from win the inbox.
The MailerLite dataset (3.6M campaigns) breaks down cleanly:
| Industry | Open rate (2025) | Tier |
|---|---|---|
| Religion | 55.71% | Highest |
| Hobbies | 53.25% | Highest |
| Non-profit | 52.38% | Highest |
| Consulting | 45.96% | Above average |
| Authors | 43.14% | Around average |
| Publishing | 34.24% | Below average |
| E-commerce | 32.67% | Below average |
| Travel & transport | 30.10% | Lowest |
Klaviyo's e-commerce-specific data tells a parallel story:
What this means for operators: an e-commerce list opening at 33% isn't underperforming — that is roughly the sector norm. A non-profit or niche-hobby list opening at 33% has a problem. Benchmark within the industry, not against a blended global figure that mixes passion-driven non-profits with discount-fatigued retail.
What is a good email click-through rate by industry?
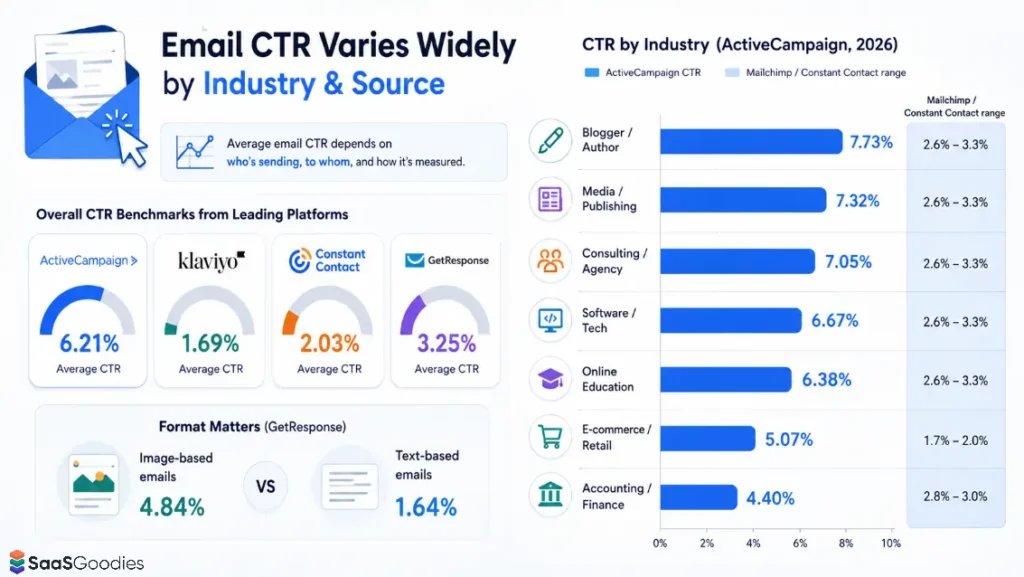
Average email CTR by industry ranges from 1.7% to 7.7%, depending almost entirely on which formula and audience the report uses. This is the open-rate problem all over again — the headline CTR number is meaningless without its source.
The clearest illustration: three reputable platforms, three different “averages.”
ActiveCampaign's by-industry figures run high because they fold in transactional and other email types:
| Industry | CTR (ActiveCampaign, 2026) | Mailchimp/Constant Contact range |
|---|---|---|
| Blogger / Author | 7.73% | 2.6–3.3% |
| Media / Publishing | 7.32% | 2.6–3.3% |
| Consulting / Agency | 7.05% | 2.6–3.3% |
| Software / Tech | 6.67% | 2.6–3.3% |
| Online Education | 6.38% | 2.6–3.3% |
| E-commerce / Retail | 5.07% | 1.7–2.0% |
| Accounting / Finance | 4.40% | 2.8–3.0% |
A few clarifying numbers:
What this means for operators: before quoting a CTR target, check whether the source measures campaigns only or includes automated and transactional sends — the latter doubles the number. For a promotional newsletter, 2–3% is realistic. For an automated flow, 5–6% is the bar. Comparing a campaign CTR to an ActiveCampaign-style blended figure will make a healthy program look broken.
When is the best time and day to send email?
The highest peak open rate of the week lands on Friday at 6 PM (49.7%), with mid-week mornings and early evenings consistently strong — based on an analysis of 2,138,817 campaigns. Send time moves engagement, though less than subject line and list quality do.
From MailerLite's 2026 study (US, UK, Australia, Canada; Dec 2024–Nov 2025):
Other large datasets point to the evening for clicks:
| Goal | Best window |
|---|---|
| Highest open (peak hour) | Friday 6 PM (49.7%) |
| Strong weekday opens | 6–11 AM |
| Highest clicks | 8–9 PM |
| Best day overall | Tuesday (also Thursday) |
| B2B engagement | 9 AM–12 PM |
What this means for operators: treat these as starting points, not laws — MailerLite's own analysts say the only send-time study that matters is the one run on your own list. AI-powered send-time optimisation increased open rates by 23% over static timing in one analysis, which beats any universal “best hour”. Pick a sensible default (Tuesday or Thursday morning for B2B, weekday evening for B2C), then A/B test around it.
How much do subject lines and personalisation move the needle?
Using a recipient's name in the subject line increases opens by 26%, and personalisation broadly is the cheapest reliable lever in email. The subject line is the only part of an email most recipients ever see.
What this means for operators: personalisation tokens cost nothing and reliably add double-digit percentage points to opens. Emojis are a test, not a tactic — they help in some sectors and hurt in others. And the biggest engagement multiplier of all is relevance: transactional and triggered messages crush broadcast sends because the recipient is already paying attention. Earn the open by sending what someone actually asked for.
Newsletter vs automated email benchmarks — which performs better?
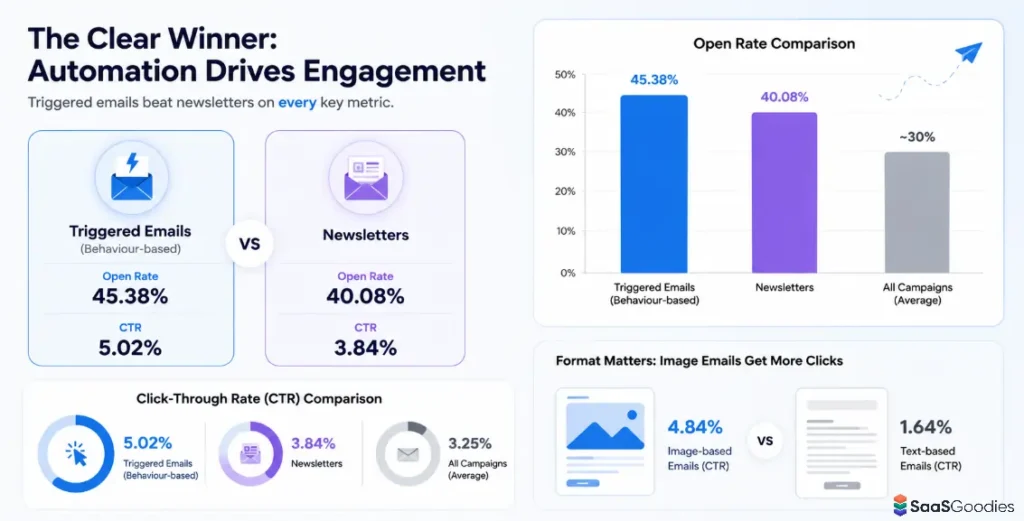
Triggered and automated emails outperform newsletters on every engagement metric — triggered emails open at 45.38% versus 40.08% for newsletters — because they arrive in the context of something the recipient just did. The type of email predicts performance as reliably as the industry does.
GetResponse's data, drawn from around 7 billion messages, separates email by type:
| Email type | Open rate | CTR |
|---|---|---|
| Triggered (behaviour-based) | 45.38% | 5.02% |
| Newsletter | 40.08% | 3.84% |
| All campaigns (average) | — | 3.25% |
The format of the email matters too:
What this means for operators: the engagement gap between a triggered email and a newsletter isn't a content problem — it is a timing and relevance advantage that no subject line tweak can replicate.
If a program leans entirely on weekly broadcasts, the fastest lift is adding behaviour-triggered sends (welcome, post-purchase, re-engagement) that ride the moment of intent.
For affiliate operators, that means an automated onboarding email sequence will almost always out-click a generic newsletter blast.
Realistic targets at a glance
Translating the verified ranges above into thresholds a campaign can actually be judged against:
| Metric | Needs work | Average | Strong |
|---|---|---|---|
| Open rate (promotional) | <30% | 37–43% | >45% |
| Click rate (campaign) | <1.5% | 2–3% | >3.5% |
| Click-to-open rate | <8% | 10–15% | >15% |
| Flow / automated CTR | <4% | 5–6% | >6% |
| Unsubscribe rate | >0.5% | ~0.2% | <0.1% |
What about mobile, conversion and unsubscribes?
Around 55% of email opens now happen on mobile devices, and the average campaign conversion rate is just 0.08% — with top performers reaching five times that. The inbox is a phone, and most clicks never become a sale.
What this means for operators: with half of opens on mobile, a single-column layout, 14px+ text and thumb-sized buttons aren't optional.
And the gap between a 0.08% and 0.44% conversion rate is the whole game — it is segmentation, offer relevance and timing, not template polish. The rising unsubscribe rate is a quiet signal that inboxes are fuller and patience is thinner.
What email benchmark statistics mean for 2026
Five takeaways for anyone setting targets this year, caveats included:
- MailerLite — “Email Marketing Benchmarks 2025.”
- MailerLite — “The Best Time to Send Email in 2026” (statistical analysis).
- MailerLite — “42+ Email Marketing Statistics.”
- Klaviyo — Email marketing benchmarks.
- Mailchimp — Email marketing benchmarks by industry.
- ActiveCampaign — “Email Marketing Benchmarks.”
- GetResponse — “Email Marketing Benchmarks” report.
- Omnisend — “2026 Ecommerce Marketing Report.”
- HubSpot — “Average Email Open Rate Benchmark.”
- Litmus (Validity) — Email Client Market Share & State of Email.
- Moosend — “Best time to send campaigns” (10B-email analysis).
- Prospeo — “Average Email CTR by Industry: 2026 Benchmarks” (8-source synthesis).