Email Marketing Statistics 2026: ROI, Usage & Benchmarks

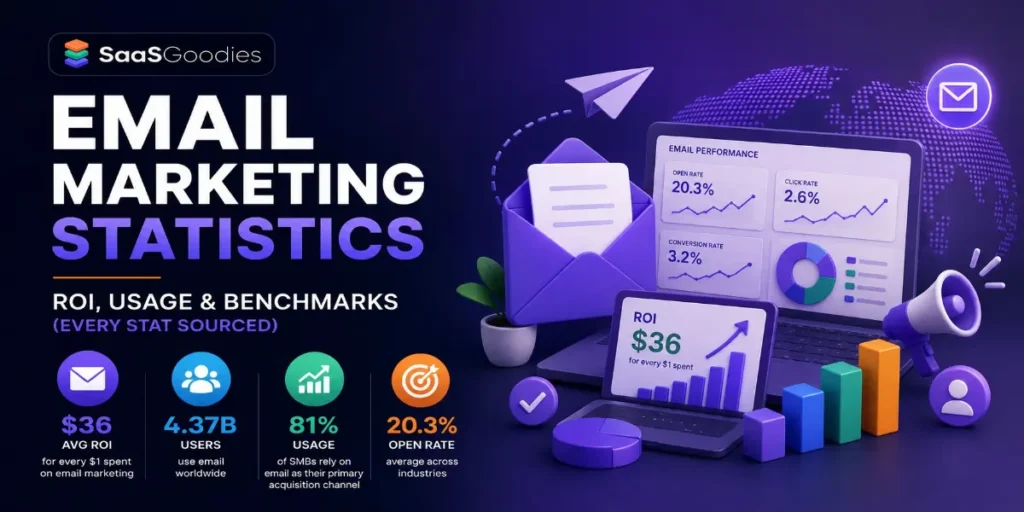
Email marketing returns about $36 for every $1 spent — a 3,600% return that no other digital channel reliably matches. That single number explains why a 50-year-old channel keeps outliving every “email is dead” headline.
Email marketing is the practice of sending commercial messages — promotions, newsletters, transactional and automated flows — to a permission-based list of subscribers. It is the only owned channel where a marketer reaches an audience without renting access from an algorithm.
The email marketing statistics below are pulled from primary publishers — Statista, Litmus, GetResponse, MailerLite and Omnisend — every one cited inline and dated. Where the data disagrees (and on open rates, it disagrees a lot), that gets flagged rather than smoothed over.
Key Email Marketing Stats at a Glance
How big is the email marketing industry in 2026?
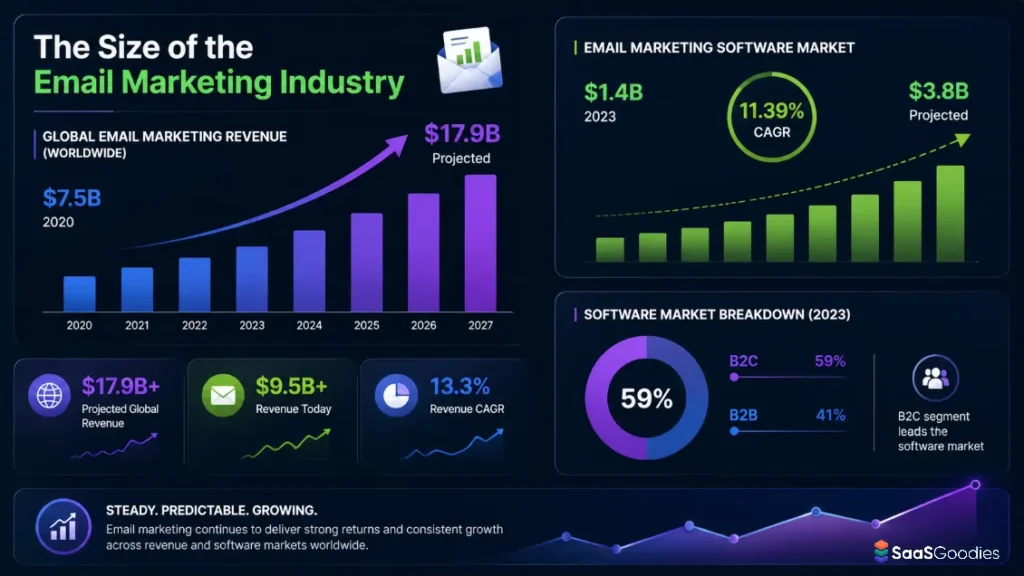
Global email marketing revenue was projected to pass $9.5 billion in 2024 and reach $17.9 billion by 2027, a compound annual growth rate of 13.3%.. The channel grows quietly — no funding rounds, no hype cycle — but it grows every year.
The headline “market size” depends entirely on what gets measured. The broad email marketing market (services, agencies, spend) and the narrower email marketing software market are two different numbers, and writers conflate them constantly. Here is the honest version:
| Metric | Value | Period |
|---|---|---|
| Email marketing revenue (worldwide) | $7.5B → $17.9B | 2020–2027 (proj.) |
| Email marketing revenue (proj.) | >$9.5B | 2024 |
| Email marketing software market | $1.4B → $3.8B | 2023–2032 (proj.) |
| Software market CAGR | 11.39% | 2024–2032 |
A few things stand out:
What this means for operators: treat the eye-catching $17.9B as a backdrop, not gospel — it is an old projection. When a campaign report needs a defensible market number, the software-market CAGR of ~11% is the safer one to quote, and you can always cite its publisher and year.
How many people use email, and how many emails get sent?
There are roughly 4.6 billion email users worldwide in 2025, projected to reach 4.89 billion by 2027. For context, that is more than half the planet — and more accounts than every major social network combined.
Volume is the other half of the story, and it is staggering:
| Metric | Figure |
|---|---|
| Email users worldwide (2025) | ~4.6 billion |
| Projected users (2026) | ~4.73 billion |
| Projected users (2027) | ~4.89 billion |
| Emails per day (2025) | ~376 billion |
| Projected emails per day (2027) | ~408 billion |
What this means for operators: the audience is not shrinking — the inbox is just more crowded. With 376 billion emails competing daily, the constraint is no longer reach; it is attention. Subject line, sender reputation and segmentation decide whether a send lands or drowns. The affiliate marketing email funnel lives or dies on list health, not list size.
What ROI does email marketing actually deliver?
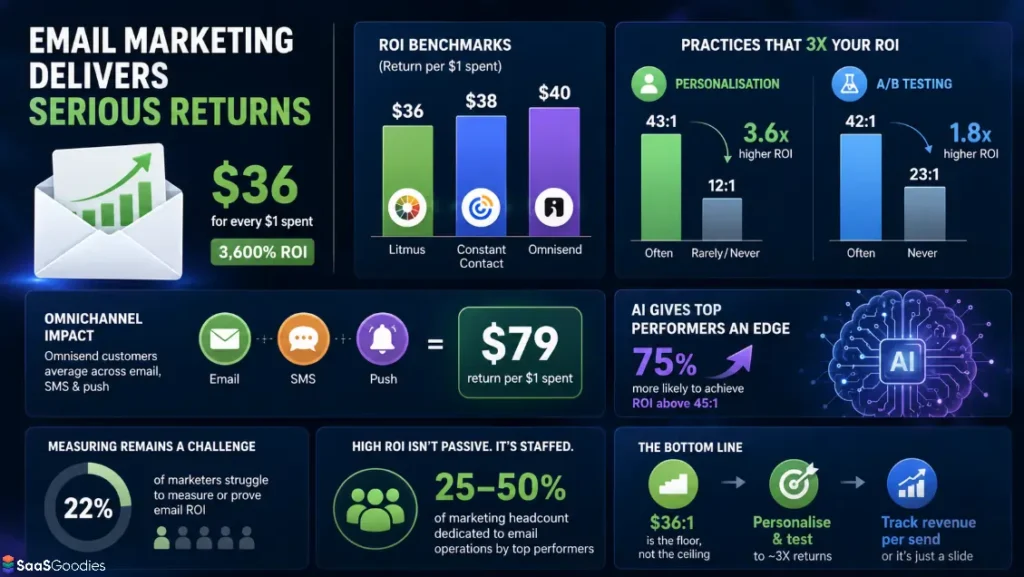
Email marketing returns approximately $36 for every $1 spent — a 3,600% ROI — according to the Litmus State of Email. That figure originated in Litmus's 2020 State of Email survey of more than 2,000 marketing professionals and was reaffirmed in its 2025 survey of nearly 500 marketers.
The “$36” number gets quoted everywhere. Here is the context almost nobody adds: the figure varies by source and methodology, and it climbs sharply with two specific practices.
| Practice | Reported email ROI |
|---|---|
| Industry average | 36:1 ($36 per $1) |
| Personalise often | 43:1 |
| Rarely/never personalise | 12:1 |
| A/B test often | 42:1 |
| Never A/B test | 23:1 |
There is a catch behind the rosy averages: 22% of marketers say they struggle to measure or prove email ROI at all. The teams hitting 36:1 to 50:1 tend to dedicate 25–50% of their marketing headcount to email operations. High ROI is not passive; it is staffed.
What this means for operators: quote $36:1 as the floor, not the ceiling. The lever that moves it is not a fancier template — it is personalisation and disciplined testing, which roughly triple the return. If a program isn't tracking revenue per send, the “$36” is just a slide, not a measurement.
What are the average email engagement benchmarks in 2026?
The average email open rate reached 43.46% in 2025, up from 42.35% in 2024, based on more than 3.6 million campaigns. Click rates and click-to-open rates rose too — but the open-rate number deserves a giant asterisk.
Here is the clean year-over-year movement from one consistent dataset:
| Metric | 2024 | 2025 |
|---|---|---|
| Average open rate | 42.35% | 43.46% |
| Average click rate | 2.00% | 2.09% |
| Average click-to-open rate | 5.63% | 6.81% |
| Average unsubscribe rate | 0.08% | 0.22% |
Now the asterisk. Different platforms report wildly different open rates because of methodology and Apple's Mail Privacy Protection (MPP), launched September 2021, which pre-loads images and registers “opens” even when nobody reads the email:
What this means for operators: stop treating open rate as a north-star metric. Since MPP, it is a vanity number inflated by a phantom 18 points. Click-to-open rate (which rose to 6.81% in 2025) and revenue per send are the metrics that survive privacy changes. Benchmark against your own history, not a cross-industry average built on a different counting method.
How well does email automation perform?
Automated emails account for just 2% of total sends yet drive 37% of all email-attributed sales. If there is one stat that should reshape a sending calendar, it is that one.
The gap between automated flows and one-off campaigns is not marginal — it is enormous:
| Automation type | Standout metric |
|---|---|
| All automated emails | 2% of sends → 37% of email sales |
| Automated vs campaigns | +52% opens, +332% clicks, +2,361% conversions |
| Abandoned cart + welcome | 76% of all automation orders |
| Back-in-stock | 6.46% conversion (highest of any type) |
| Birthday | $744.37 average order value (4x average) |
What this means for operators: if a welcome flow and an abandoned-cart sequence aren't live and optimised, that is the first fix — they generate three-quarters of automation revenue between them. For affiliates, the same logic applies to onboarding and re-engagement sequences: the set-and-forget automated email flow out-earns the weekly blast on a per-send basis by a margin that is hard to overstate.
Which email clients and devices dominate the inbox?
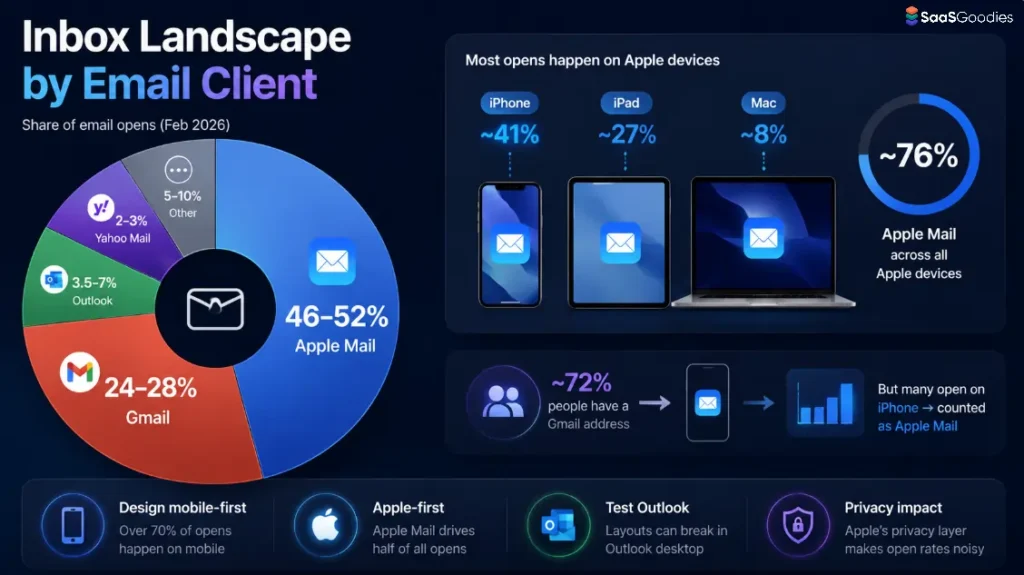
Apple Mail accounts for roughly 46–52% of all email opens, making it the single most important client to design for — calculated from over 1.1 billion opens in Litmus Email Analytics in February 2026. Where an email is opened now matters as much as the subject line.
The current distribution of opens:
| Email client | Approx. share of opens |
|---|---|
| Apple Mail (iPhone/iPad/Mac) | ~46–52% |
| Gmail | ~24–28% |
| Outlook (desktop) | ~3.5–7% |
| Yahoo Mail | ~2–3% |
There is a crucial distinction here: who holds an account is not the same as which client they open in. Surveys suggest around 72% of people have a Gmail address, yet many of them read on an iPhone — so their opens register as Apple Mail.
What this means for operators: design mobile-first and Apple-first, because that is where half your opens happen — then test rendering in Outlook, which still mangles layouts that look fine everywhere else. The account-vs-client gap also explains why open-rate tracking is so noisy: Apple's privacy layer sits in front of a huge share of your list.
How are marketers using AI in email?
The use of generative AI to create email images surged 340% between 2024 and 2025. AI moved from experiment to default workflow inside a single year.
The adoption and productivity signals are consistent across sources:
What this means for operators: AI's real win in email isn't flashier copy — it is speed and segmentation. Teams cutting production from two weeks to three days can test more, send more relevant messages, and react to behaviour faster. That is where the ROI uplift comes from. Treat AI as a throughput and targeting tool, not a magic subject-line button.
Does email still beat other channels for ROI and retention?
Email remains the channel marketing leaders most often rate highest for ROI, and around 60% of consumers prefer to be contacted by businesses over email. Owned, permission-based reach is the moat.
Supporting signals:
What this means for operators: email isn't competing with SMS and push — the winning programs run them together. But email is still the anchor: it carries the long-form content, the offers, and the relationship. For affiliates, owning an email list is the closest thing to an algorithm-proof asset there is.
What email marketing statistics mean for 2026
A few takeaways for anyone who runs campaigns, with the caveats attached:
Projection check — the directional, sourced forecasts worth watching:
| Forecast | Figure |
|---|---|
| Email users worldwide by 2027 | ~4.89 billion |
| Daily email volume by 2027 | ~408 billion |
| Email software market by 2032 | $3.8 billion |
| Teams deploying email within 3 days by 2026 | 76% |
Put the numbers to work
Benchmarks are only useful if they change a decision. If a list is underperforming the figures above, the fastest wins are usually segmentation and a tightened automation flow.
Build clean tracking links first with the free, compare programs in the, and for the weekly No-BS Affiliate Report — real numbers, no theory — the newsletter is the place to start.
- Statista — “E-mail marketing revenue worldwide from 2020 to 2027.”
- Statista — “E-mail marketing worldwide: statistics & facts.”
- Statista — “Number of sent and received e-mails per day worldwide.”
- Litmus (Validity) — “The ROI of Email Marketing” / State of Email.
- Litmus (Validity) — “Email Client Market Share” (February 2026).
- Litmus (Validity) — “Trends in Email Marketing” / State of Email Reports.
- Litmus (Validity) — “2025 State of Email Crossover Recap.
- MailerLite — “Email Marketing Benchmarks 2025.
- GetResponse — “Email Marketing Benchmarks” report.
- Omnisend — “2025 Ecommerce Marketing Report.
- Omnisend — “2026 Ecommerce Marketing Report.
- HubSpot — “Email Marketing Benchmarks by Industry.
- Validity — “State of Email 2025 Report” (PR Newswire).
- SNS Insider — “Email Marketing Software Market.
- ActiveCampaign — “Email Marketing Benchmarks.